

Small-cap stocks appeal to many for fast gains on trades, but it’s just as easy to get caught up in a situation that leads to a loss.
Dilution Tracker is built to uncover the financing risks that can quietly reshape a small-cap stock setup, but does it live up to expectations?
In this Dilution Tracker review, I’ll examine how well the platform organizes that research, what it reveals about dilution risk, and whether it offers enough value for folks who follow small-cap stocks closely.
>> Join Dilution Tracker And Research Smarter <<

What Is Dilution Tracker?
Dilution Tracker turns complex SEC filings into actionable small-cap research by tracking warrants, convertibles, ATMs, equity lines, shelf capacity, and pending offerings in one place. Its dilution profiles, proprietary risk ratings, and alerts can save investors significant time when evaluating potential share-supply risks. Dilution Tracker combines automated filing monitoring with manual dilution calculations and research cross-checked by a team with more than 20 years of combined market experience. Its research found small-cap offering announcements were associated with average stock-price declines of roughly 20%–30%. Dilution Tracker is highly specialized around small-cap and micro-cap financing risk, so investors focused mainly on larger, established companies may have less need for its toolset. Its data also works best as one component of a broader research process rather than a standalone investment signal.
Dilution Tracker is an online research platform built for people who spend time in U.S.-listed small-cap stocks and want a clearer view of potential share dilution.
Its team reviews SEC filings and company disclosures to track warrants, convertibles, at the market agreements (ATMs), equity lines, shelf capacity, pending S-1 offerings, and other sources of new supply.
The main idea is simple: a stock can have strong demand, but that setup can change fast if the company has room to issue a large block of shares.
Dilution Tracker helps surface that risk before it becomes obvious on the chart.
Members also get access to offering history, cash-need context, dilution ratings, filing alerts, and research that explains how different financing structures can affect price action.
The service is especially useful for anyone who wants to understand not just whether a company can raise capital, but how much it may be able to raise and through which route.
It’s a practical shortcut when you want to spend less time digging through filings and more time evaluating the full setup.
>> Start Your Dilution Tracker Free Trial <<
Is Dilution Tracker Legit?
Dilution Tracker comes across as a legitimate research platform because its core work is tied to information you can check against public company disclosures.
 The service digs through SEC filings, press releases, 10-Ks, and 10-Qs to identify financing structures that may lead to future dilution.
Its team tracks things like warrants, convertibles, ATMs, equity lines, shelf capacity, and pending S-1 offerings, then organizes that data into a format that is easier to use.
I also like that the research doesn’t treat every source of dilution as automatically negative.
The team actively processes news and frames it appropriately, giving the platform more credibility than a simple warning system that labels every financing event as bad.
Who Is Behind Dilution Tracker?
Dilution Tracker grew out of a problem its founding team had already experienced firsthand.
One of the founders kept taking losses in small-cap stocks because millions of newly created shares would suddenly hit the market. The underlying businesses were not always the issue.
Dilution got buried inside filings that was easy to miss until the selling pressure showed up.
That experience eventually brought together a team of market participants who wanted to make this information easier to find.
I can’t find any of their names on the website, but Shawn Stevenson is credited with most of the informational articles.
>> Explore Dilution Tracker Premium Today <<
How Does Dilution Tracker Work?
Dilution Tracker takes information that is scattered across SEC filings and turns it into a clearer picture of a company’s potential share supply.
 Once you pull up a stock, the platform can show whether the company has active warrants, convertible securities, an ATM, an equity line, available shelf capacity, or a pending S-1 offering.
It also reviews recent financing history, cash needs, and other details that can help explain how likely the company is to raise more capital.
To that end, the service uses available S-3 shelf capacity and pending S-1 filings to judge whether a company has a practical route to complete a public offering.
You can also see recent deals and the investment banks involved, which adds another layer of context when evaluating financing risk.
In practice, that means I can spend less time jumping between filings and more time looking at the complete supply picture before deciding whether a setup deserves further research.
>> Get Full Access To Dilution Tracker <<
Why Stock Dilution Matters
Small-cap stocks do not depend only on buying and selling between existing shareholders.
Many smaller companies also create new shares to fund operations.
That is especially common among businesses with heavy cash needs, such as biotech firms and early-stage technology companies.
When those shares reach the market, they add fresh supply that can work against the demand already pushing the stock higher.
Dilution Tracker’s research found that small-cap offerings caused an average stock-price drop of around 20% to 30% on announcement, with the outcome varying based on the deal structure, warrant coverage, and the investment bank involved.
That does not mean every stock with dilution risk will fall, as a strong catalyst can still create enough demand to absorb extra supply.
The real advantage is understanding whether a company has the ability and incentive to issue more shares before that risk becomes obvious in the price.
>> Try Dilution Tracker For Seven Days <<
Dilution Tracker Review: All the Best Features Explained
Dilution Tracker is much more than a list of recent offerings.
The real value comes from how it connects share structure, financing capacity, SEC filings, and alerts so you can see where new supply may come from before it changes the setup.
Dilution Profiles
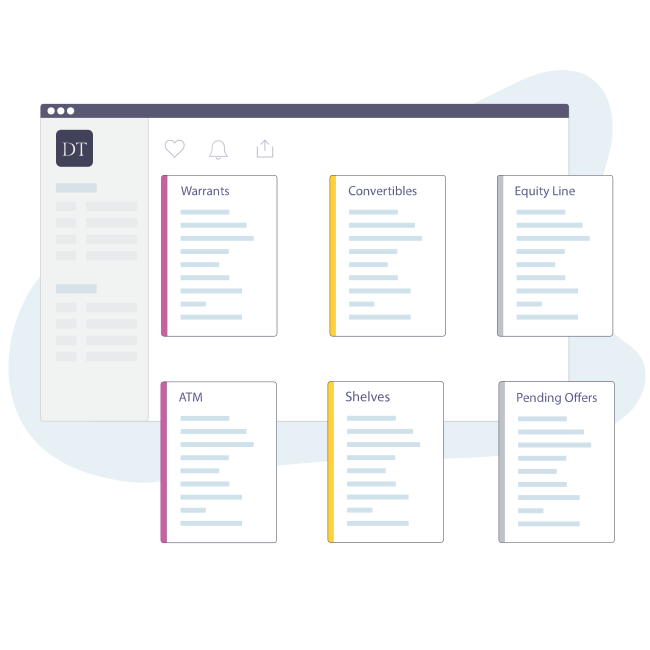 The dilution profile gives you the fastest read on a company’s capital structure.
Instead of opening several SEC filings to check each financing method separately, you can see whether there are active ATMs, warrants, convertibles, equity lines, pending S-1 offerings, or unused shelf capacity in one place.
Dilution Tracker also uses this information in its proprietary dilution rating, which considers the different ways a company could create new shares.
The platform updates regularly, so you’re not stuck looking at stale data. Another cool note is that the team performs their own manual dilution computations to reduce error.
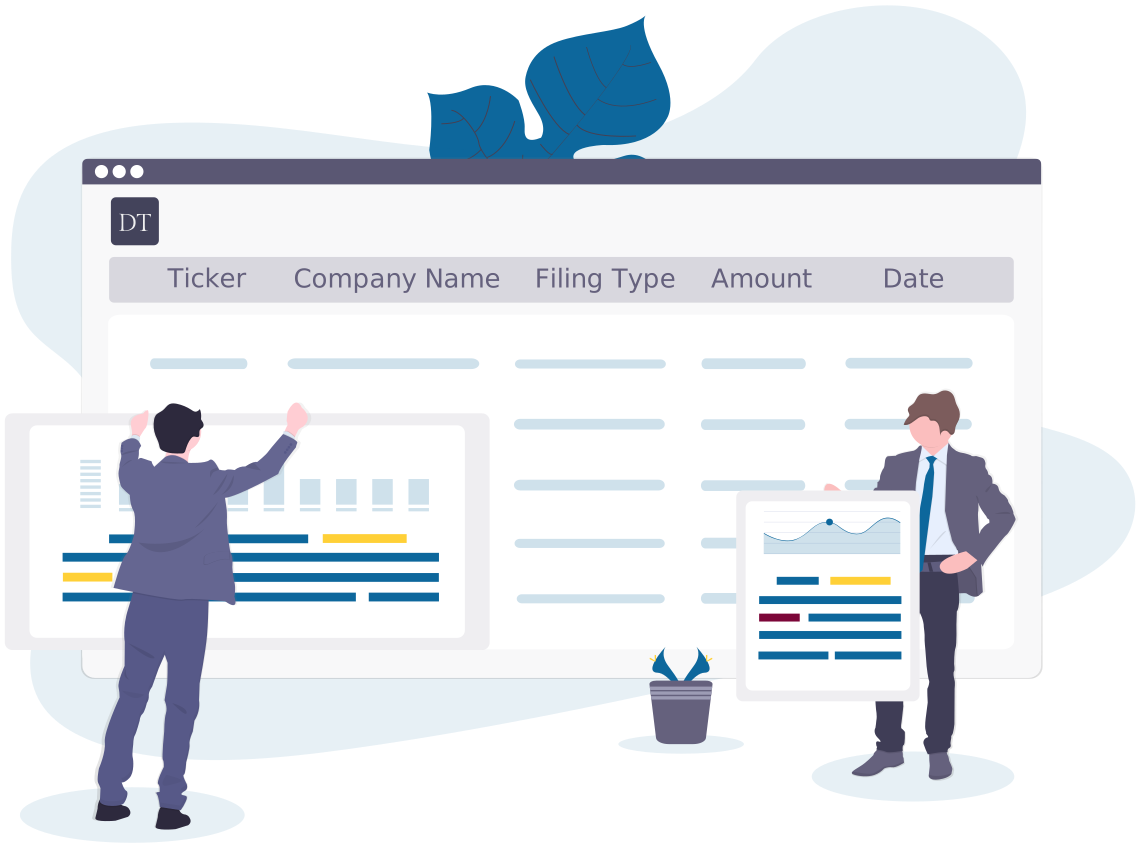 Another feature is the outstanding shares and potential dilution view, which helps separate the shares already in circulation from supply that could appear later.
This matters because a low current float can look attractive until you notice a large block of warrants, convertibles, or another financing source sitting overhead.
Dilution Tracker does not treat every potential share as guaranteed issuance either.
The platform looks at the size and structure of each instrument so you can judge how meaningful it is relative to the float and trading volume.
That makes the chart more useful than simply displaying one fully diluted share count.
>> Upgrade Your Research With Dilution Tracker <<
S-1 Offering Tracking
The Pending S-1 section is one of the features I would pay close attention to with smaller companies.
An S-1 is commonly associated with an IPO, but small-cap companies also use the filing to register shares for secondary offerings.
These deals often raise around $5 million to $20 million and may include warrants, making the final financing more dilutive than the headline share count first suggests.
Dilution Tracker keeps a list of S-1 offerings that are still in progress, which helps flag companies with a capital raise already moving through the registration process before the final pricing appears.
Shelf Registrations
Shelf registrations tell whether a company already has a framework in place to raise capital.
Dilution Tracker tracks the remaining capacity on an S-3 shelf and adjusts the available amount when the company raises money through instruments tied to it.
One detail I like is the context around very large shelves. A shelf worth several times the company’s market cap does not mean all of those shares will appear at once.
Shelves are generally intended for use over several years, so treat the capacity as potential financing room.
>> Access Dilution Tracker’s Small-Cap Research <<
ATM Offering Tracking
ATMs are easy to underestimate because companies can sell shares gradually instead of announcing one large block offering.
Once an ATM is active, management can generally issue shares into the open market up to the authorized amount, which makes current usage important.
Dilution Tracker follows ATM agreements and looks at factors such as remaining capacity, trading volume, valuation, cash needs, and the bank handling the program. Timing matters too.
An ATM may sit unused for months, but heavy volume after a strong run can give a cash-hungry company an attractive opportunity to raise money without completing a traditional discounted offering.
Warrants and Convertible Securities
Warrants and convertibles can create less obvious dilution because the shares may not yet exist in the public float.
These tools give holders the right to acquire stock at a set exercise price, which becomes more attractive when the market price moves well above that level.
Still, the impact depends on the number of warrants compared with daily volume and outstanding shares.
Convertible notes can create similar selling pressure when holders convert debt into stock and sell above their conversion price.
The platform also tracks price-protection clauses that can lower conversion or exercise prices and increase the number of shares issuable.
Equity Lines
Equity lines give companies another way to raise capital gradually, and they can look similar to ATMs at first glance.
The key difference is that an equity-line provider normally agrees to purchase shares from the company under a set formula, often at a discount to the prevailing market price.
A company can then request capital in smaller draws, subject to volume, price, and agreement limits.
Dilution Tracker tracks these arrangements alongside ATMs because both can increase supply without a single traditional offering announcement.
Seeing the remaining capacity and terms helps me judge whether an apparently tight share structure could expand as trading volume increases.
>> Track Dilution Faster With Dilution Tracker <<
Leading Education Content
Outside of dilution tracking, there’s a comprehensive education section to help you understand what each filing actually means.
Dilution Tracker provides short guides, flowcharts, tables, FAQs, and deeper research covering ATMs, shelves, warrants, S-1 registrations, equity lines, convertible notes, registered shares, and the Baby Shelf Rule.
There is also a dedicated SEC filing cheat sheet and original research based on small-cap offering data.
The team arranges the material from basic concepts through more technical financing structures, so you can quickly refresh a term without leaving the platform to hunt down a legal definition.
SEC Filing Monitoring
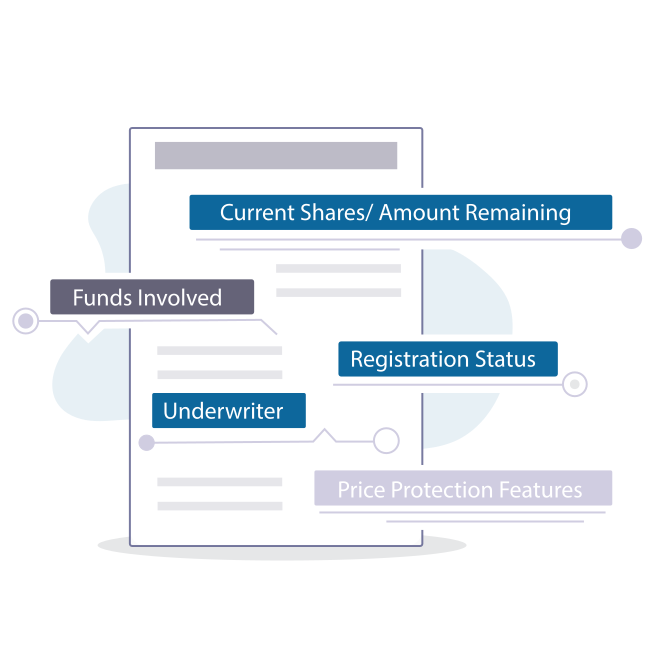 Filing coverage is where the service saves a lot of manual work, and Dilution Tracker goes way beyond headline offering announcements.
Its data incorporates relevant press releases along with updates buried in 10-Ks, 10-Qs, registration statements, prospectus supplements, and other SEC filings.
Dilution calculations then get cross-checked by a group with more than 20 years of combined market experience.
That matters because details such as conversion clauses, warrant adjustments, underwriters, and actual financing usage can be spread across multiple documents.
New filings are added continually, giving a more current view without rebuilding the capital structure by hand.
Email and SMS Alerts
 The alert system makes Dilution Tracker more practical once I have a group of stocks I want to monitor.
You can choose email, SMS, or both and decide how broad the ticker coverage should be.
The current setup supports alerts across all publicly traded U.S. tickers, Dilution Tracker’s custom coverage of roughly 2,500 companies, or a personal watchlist.
You can also combine the platform’s list with your own tickers. SMS verification is currently limited to U.S. and Canadian phone numbers.
That flexibility means that you don’t need to keep refreshing filings manually just to catch a material update.
>> See Dilution Risk With Dilution Tracker <<
What I Like About Dilution Tracker
What stands out most about Dilution Tracker is how much time it can save when researching small-cap stocks.
Instead of opening several SEC filings to piece together warrants, shelf capacity, ATMs, convertibles, and pending offerings, I can see the main dilution risks in one place.
I also like that the platform adds context instead of treating every financing event as a red flag.
A large shelf or active ATM does not automatically mean heavy selling is coming, and the research material does a good job of explaining those differences.
The education library is another strong point.
It helps make the data easier to interpret, especially if you are still getting comfortable with terms like equity lines, warrant exercises, and S-1 registrations.
Where Dilution Tracker Has Limitations
Dilution Tracker is useful, but it works best when you treat it as one part of the research process rather than a standalone decision tool.
A high dilution rating does not guarantee that a stock will fall, just as a clean share structure does not guarantee that it will rise.
Demand, catalysts, company fundamentals, cash needs, and trading volume can all change how new supply affects the price.
Another point to keep in mind is that most of the underlying information comes from public SEC filings and company disclosures.
You could gather much of it yourself for free if you have the time and experience.
The value here comes from having that information organized, monitored, and easier to interpret.
>> Research Small Caps With Dilution Tracker <<
Who Should Use Dilution Tracker?
I think Dilution Tracker makes the most sense for people who regularly research small-cap and micro-cap companies, especially names that rely on frequent capital raises.
It’s particularly useful around biotech stocks, low-float setups, recent reverse splits, and companies with warrants, active shelves, ATMs, convertibles, or pending offerings.
Those are the situations where share structure can change quickly and where missing one filing can completely alter the picture.
The platform can also be useful whether your outlook is bullish or bearish.
If I like a company, I can use it to check for financing risk before getting too confident.
Alternatively, I can see whether potential dilution supports that view rather than relying on price action alone.
Dilution Tracker vs. Reading SEC Filings Yourself
You do not need Dilution Tracker to access SEC filings.
EDGAR is free, and anyone willing to spend enough time digging through registration statements, prospectus supplements, 10-Qs, 10-Ks, and 8-Ks can build much of the same picture manually.
The difference is efficiency.
When I research a small-cap stock myself, the important details may be spread across several filings and amendments.
One document may contain the ATM, another the warrants, while an older registration statement explains the shelf capacity.
Dilution Tracker pulls those pieces together into a more usable format, so the decision really comes down to time.
If you want the same information organized faster, the subscription becomes much easier to justify.
>> Unlock Premium Dilution Data Today <<
Refund Policy
 Dilution Tracker gives new customers a 7-day refund window from the initial purchase date.
After that period, payments become non-refundable, including renewal charges and cancellations made before the end of a billing term.
You can cancel their subscription at any time, but cancelling early does not create a prorated refund or account credit.
I reviewed Dilution Tracker from a practical research standpoint, and these are the pros and cons that stood out most.Pros and Cons
Pros
Cons
>> Start Tracking Small-Cap Dilution Today <<
How Much Does Dilution Tracker Cost?
Dilution Tracker has a free Casual plan plus two Premium billing options.
The free tier includes unlimited searches across more than 2,300 tickers, the education library, audited float data, and institutional ownership, making it a solid way to explore the platform before paying.
The Premium Monthly plan costs $74 per month and comes with a 7-day free trial.
If you want to save some money, the Annual plan costs $588 per year, which works out to $49 per month and saves 33% compared with monthly billing.
Premium unlocks all data fields, live shelf data, dilution risk ratings, completed offerings, latest dilution filings, filing and press-release alerts, and short-interest data.
>> Access Dilution Tracker’s Filing Alerts <<
Is Dilution Tracker Worth It?
After using the platform and digging into its methodology, I think Dilution Tracker makes the most sense for people who regularly research small-cap stocks where financing risk can change the setup quickly.
It gives ATMs, S-1s, equity lines, warrants, shelf capacity, and other dilution sources a cleaner framework, which saves a lot of time compared with rebuilding the picture from SEC filings alone.
That does not mean the service replaces judgment.
Dilution data is only one part of the story, and strong demand can still outweigh new supply. Still, my overall takeaway from this Dilution Tracker review is positive.
If share structure and financing risk matter to your process, Dilution Tracker offers a focused toolset that can make that research much easier.



 Tags:
Tags: