Marc Chaikin’s company has made a name for itself as a sophisticated research publisher. But do its insights and stock research tools really live up to their reputation? Check out my Chaikin Analytics review for a look into this elite publisher and its entry-level newsletter, Power Gauge Report.
What is Chaikin Analytics?
A 20-factor proprietary stock and ETF rating system (Power Gauge/Power Pulse) covering 4,000+ securities — clear Very Bullish to Very Bearish outputs with plain-English subcategory explanations, paired with a monthly mid-to-large-cap newsletter, model portfolio, three AI bonus reports, and full-year browser-based Power Pulse access; backed by Marc Chaikin's 40+ years of institutional experience; entry at $49/year (75% off from $199)
The Power Pulse System — a web-based, no-download tool that rates 4,000+ stocks and ETFs using Marc's proprietary 20-factor framework (including the widely adopted Chaikin Money Flow indicator) and presents each rating with a plain-English category explanation; the combination of institutional-grade analytical depth with a genuinely accessible interface is rare at this price point; both first-time participants and experienced self-directed researchers can use it productively from day one
The Power Gauge ratings identify potential but do not specify buy or sell timing — users still need to apply judgment on entry and exit, which is covered in the included special report but requires some learning curve; the service delivers one pick per month, which suits patient mid-to-long-term participants but is not designed for high-frequency traders or options strategies; the introductory $49/year rate rises to $199/year at renewal, and the 30-day refund window is short relative to the 6–12 month investment horizon the strategy targets
Chaikin Analytics is a research publishing powerhouse known for its proprietary software, stock and ETF screeners, and technical indicators.
The publisher was founded back in March 2011 by Marc and his wife, Sandy, under the banner Chaikin Power Tools.
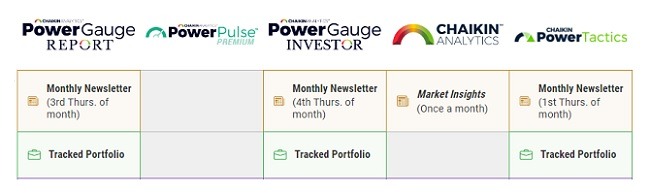
This company offers a range of top-tier services, including:
- Power Gauge Report
- Power Gauge Investor
- Chaikin Power Trader
- Chaikin PowerTactics
There’s also a free newsletter, Power Feed, that delivers daily analysis, stock ideas, earnings updates, and more.
Each service has its own investing angle, but all the analysis incorporates the Chaikin Power Gauge system’s findings (more on this later).
In terms of pricing, Power Gauge Report is the most accessible of the bunch. The newsletter also comes with one-year access to the Power Pulse System.
I’ll dig into the whole package a little further on, so stay tuned.
>> Sound like a good fit? Sign up now and save 75% <<
What Stocks Does the Company Recommend?
As mentioned, Chaikin Analytics typically recommends stocks that rate highly through its proprietary software.
That’s just one piece of the puzzle, however. The team study’s a variety of factors before recommending a position.
Their research report, The Power Gauge: How to Double Your Money on the Best Stocks, offers an in-depth look into their criteria. It could be a great place to start if you’re looking to learn how to put the ratings system to work in your own portfolio.
Each stock-picking service taps into different opportunities. Power Gauge Report, for instance, searches for mid to large-cap stocks, while Power Gauge Investor dials in on small caps.
Chaikin PowerTactics, on the other hand, recommends positions that the team believes could provide up to 5X upside potential.
Now that you know more about the publisher, let’s check out its legendary rating system, the Power Gauge.
What Is the Chaikin Power Gauge?
The Chaikin Power Gauge is a proprietary stock rating system that leverages 20 fundamental and technical factors to gauge the future outlook of 4,000+ stocks/exchange traded funds (ETFs).
And these factors are spread across four distinct categories:
- Financials
- Earnings
- Technicals
- Experts
One of the system’s metrics includes Marc’s proprietary indicator, the Chaikin Money Flow (CMF). He developed it back in the 80s to better measure “the accumulation (buying pressure) vs. distribution (selling pressure) of a stock over time.”
After analyzing the stock or ETF, the system provides a rating: Very Bullish, Bullish, Very Bearish, Bearish, or Neutral.

It is important to keep in mind that the ratings do not offer buy or sell recommendations. Timing is still a crucial factor to consider.
As mentioned, a membership to Power Gauge Report comes with a really helpful special report that breaks down in detail how to put the system to work. This includes timing an entry or exit.
I’ll run a stock through the Power Pulse software to give a demonstration of how the ratings work.
The info is members-only, so I can’t tell you what the stock is. However, if you sign up for Power Gauge Report, you’re free to scout out high-potential opportunities like this.
>> Already sold? Get started here <<
Chaikin Analytics Review: Features
Chaikin Analytics’ Power Gauge platform is jam-packed with powerful features that can help you pinpoint promising stocks before they take off.
All you have to do is type in a ticker, and the platform will present detailed data on he company, along with a non-nonsense “bullish”, “bearish”, or “neutral” rating.
It’s extremely easy to use and it will help you find promising trade opportunities in a matter of minutes.
I want to walk you through researching a ticker on the Power Gauge platform so you can see for yourself just how easy it is.
To start, simply type in a stock ticker or company in the search bar, and you’ll get an instant overview. Then the software displays an overall rating.
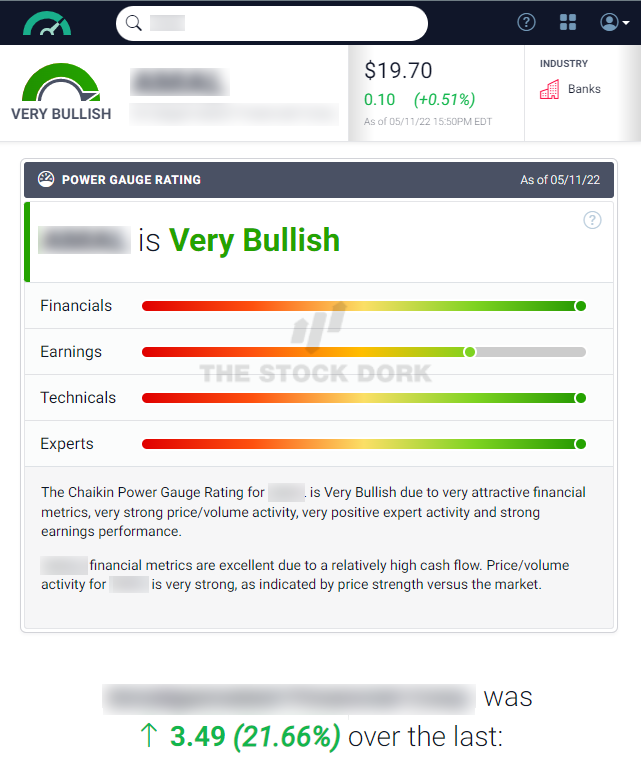
In this case, the system offered a “Very Bullish” rating.
The bottom box offers a breakdown of the platform’s reasoning for assigning the stock its overall rating, including additional ratings in several sub-categories.
Just a quick glance will give you the stock’s ratings from the perspectives of financials, earnings, technicals, and experts.
Each rating is thoughtfully determined using dozens of objective data points, so you can rest assured knowing each metric is determined through impartial methods.
You’ll also find a brief text-based description of Chaikin’s reasoning for determining its rating.
But, ratings are just the icing on the cake. You’ll also find interactive charts detailing price action, relative strength indicators, and Chaikin Money Flow status.
Chart data goes back as far as five years, and you can also view one-month, three-month, and one-year windows.
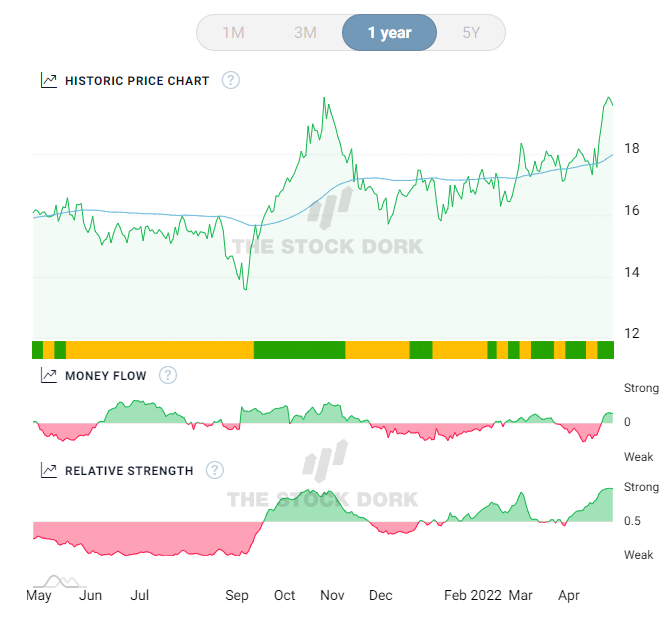
The neatly organized display has a slick interface and intuitive design, so you can easily navigate all the data.
Below the chart, you’ll also find four categories of ratings, each based on five separate indicators.
>> Get access to these features and more <<
Rating Factors
Let’s kick it off with Financials:
- Long-Term Debt to Equity
- Price to Book
- Return on Equity
- Price to Sales
- Free Cash Flow
This is what the rating looks like…
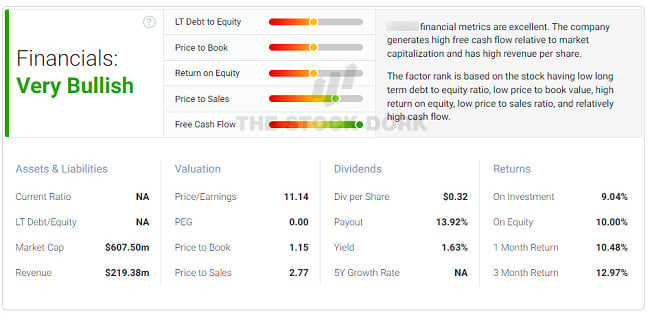
This category covers most of the info you might find on basic technical charts. A big plus is the blurb in the top-right corner that explains why a company earned its financial rating.
Next up is Earnings factors:
- Earnings Growth
- Earnings Surprise
- Earnings Trend
- Projected P/E
- Earnings Consistency
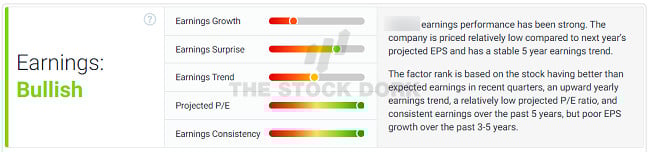
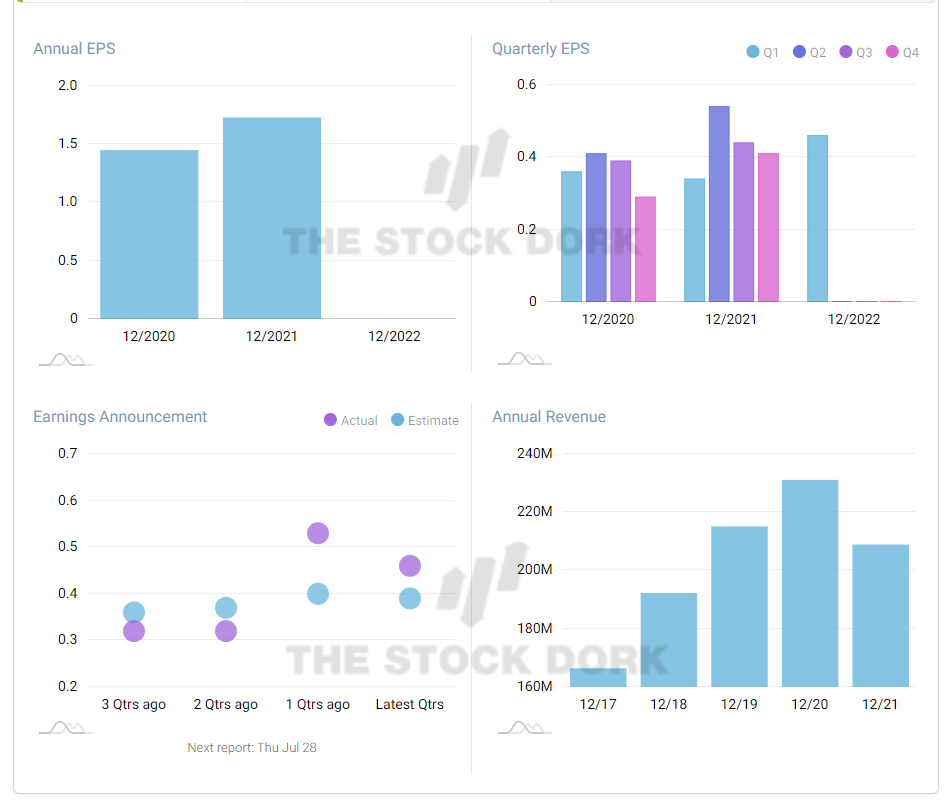
The company I looked at earned a solid Bullish rating. By scrolling a little further, there are some additional charts that cover Annual EPS, Quarterly EPS, Earnings Announcement, and Annual Revenue.
Time to head over to Technicals:
- Relative Strength
- Chaikin Money Flow Indicator
- Price Strength
- Price Trend ROC
- Volume Trend
>> Vet the right opportunities with the Power Pulse ratings system <<
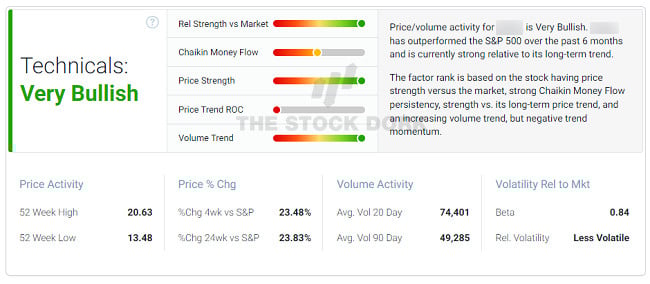
A lot of the data here is something you’d find in a standard stock price chart, but the real draw is that top-right box mentioned earlier. Beginners who get lost in the data could appreciate a succinct breakdown in plain English.
Last but not least is Experts:
- Estimate Trend
- Short Interest
- Insider Activity
- Analyst Rating Trend
- Industrial Relative Strength
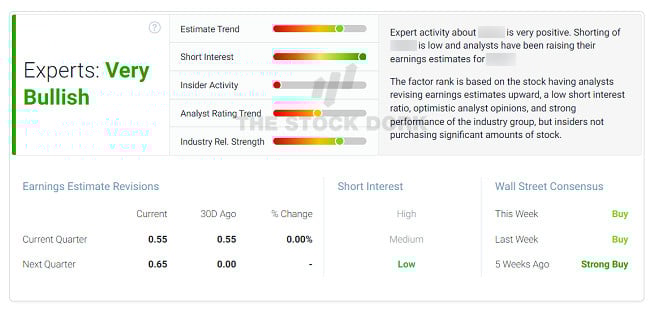
This particular rating could offer a good gauge of market sentiment, and the Wall Street Consensus is especially helpful.
Keep in mind that the stock I’m checking in on is viewed favorably by the system. But it can also warn about companies that might be about to slip.
All in all, the Power Pulse software is a solid tool for vetting opportunities and an excellent addition to the Power Gauge Report.
There’s no such thing as a stock market crystal ball that knows when prices are about to rise and fall, but it’s clear that the Power Gauge has a knack for identifying opportunities with potential.
Chaikin Analytics Review: Platform Differentiators
Chaikin Analytics Review showed us that its research tools stand out from competitors in several regards. Most notably, it’s sheer simplicity and ease of use.
The Power Gauge platform does an excellent job at balancing simplicity with a robust feature set. It won’t intimidate beginners, and it’s well equipped to accommodate the needs of even the most experienced users.
Unlike other platforms, Chaikin’s rating system clearly lists each stock as “bearish”, “bullish”, or “neutral.” Users of all skill levels can take advantage of the platform thanks to its simple and straightforward rating system.
However, don’t let the simplicity fool you. Chaikin Analytics tools aren’t lacking on capability. In fact, they’re extremely powerful, and Chaikin’s indicators are well respected on Wall Street.
Compared to other retail research platforms, Chaikin Analytics stands head and shoulders above the competition. It checks all the boxes for what I want to see in an elite tier research tool.
Now that you know more about Chaikin Analytics and its advanced rating system, let’s switch gears and check out Marc’s credentials.
>> Access invaluable insights with Chaikin Anaytics research tools <<

Is Marc Chaikin Legit?
Marc Chaikin is an investment researcher who spent over 40 years on Wall Street.
During his decorated career, he worked as a trader, analyst, and head of the options department for a major firm.
He’s developed several tools and indicators used by big wigs on The Street and everyday folks.
In fact, he even created the first real-time analytics workstation for portfolio managers and stock traders.
His success in the financial markets has drawn the attention of many media figures. CNBC’s Mad Money host, Jim Cramer, had this to say about Marc’s stock-picking abilities:
“I learned a long time ago not to be on the other side of a Chaikin trade… I want to explain why I love Marc’s stuff. It’s simple, it’s understandable, it’s rational, it’s not emotional, and I use it constantly and I almost never want to go against it.”
— Jim Cramer, host of CNBC’s Mad Money
Marc also collaborated with Nasdaq and IndexIQ to develop three ETFs based on his groundbreaking stock-rating approach.
As part of the celebration, he rang the Nasdaq opening bell, which is typically reserved for the most renowned investment experts.
Track Record
Marc and his Power Gauge have accurately predicted many market events over the years. They have also spotted stocks with serious upside potential.
In 2021, his team’s work identified four separate stocks with the potential to 2X an investment. These include Occidental Petroleum, NexTier Oilfield Solutions, CONSOL Energy, and Alcoa Corporation.
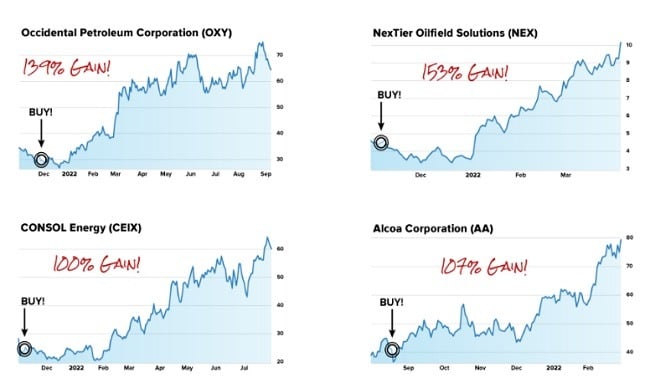
>> Discover Marc’s latest recommendations <<
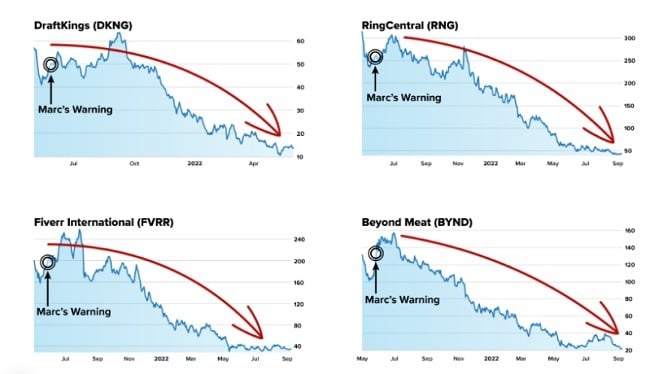
As you can see, the Power Gauge has a knack for pinpointing opportunities with profit potential. However, the software can also help warn about markets or stocks that could sour.
Back in April 2022, Marc warned that he spotted signs a bear market was looming overhead just before the S&P 500 fell by 20%.
He and his team’s research also pointed to the 2020 stock market crash, when Covid-19 was barely talked about by the press. This also included a warning about 21 different stocks that later dropped by up to 81% in the fallout.
Among them were Beyond Meat, Draft King, Fiverr International, and RingCentral.
With a track record like this, it’s no wonder why many on Wall Street consider Marc a living legend.
It’s important to keep in mind that these results are not typical, and past performance is not an indicator of future results.
Still, these examples give an idea of what is potentially at stake with a talented researcher and powerful software in the mix.
What Is Power Gauge Report?
The Power Gauge Report is an investment newsletter led by Marc Chaikin and published by Chaikin Analytics.
Some perks include monthly recommendations, access to the Power Pulse system, bonus reports, and more.
The Power Pulse is a stock and ETF rating tool that’s accessible to members throughout their subscription. This is the same feature shown earlier.
>> Sound like the right fit? Get started here! <<
What Comes with the Service?
Power Gauge Report subscriptions are packed with valuable resources and trading tools.
Continue reading our Chaikin Analytics Review for a breakdown of each one.

12-Month Subscription to Power Gauge Report Newsletter
Each month, the newsletter provides one carefully vetted trade idea along with supporting research and market commentary.
New issues are delivered on the third Thursday of every month.
The Chaikin Analytics team casts a wide net with its investment ideas. Though, they gravitate toward mid and large caps.
Some sectors they analyze include energy, technology, automotives, agriculture, and more.
Trade ideas come with commentary and the occasional warning. It’s a good place to get the team’s take on where the market could be moving next (good or bad).
Members also receive sell alerts. Sell alerts occur when the team believes it’s time to cash in on a stock or the original investment thesis changes.

Model Portfolio
The model portfolio contains all the team’s active positions.
When a new pick is added to the lineup, it’s immediately placed here.
There are all the basic bells and whistles you might expect, buy price, stop loss, stock tickers, and more.
Something I really appreciate is that you can click on the company name, and it will redirect you to the corresponding buy recommendation.
If you’re someone who wants to thoroughly vet all your trade ideas, this feature makes the process much more streamlined.

Power Pulse System
The rating system is easily my favorite part of the package.
If you prefer self-directed investing, this is a powerful tool for DIY research.
Members can access the Power Pulse System through the Chaikin Analytics website. Even better, it runs right through your browser.
There are a few big benefits to this.
For one, it doesn’t need to be downloaded. Anyone using Power Gauge ratings on multiple devices could really appreciate that.
Secondly, the computing is done on the other end, which could make it less resource intensive for devices.
Let’s dig a little deeper into how the stock ratings actually work.
>> Access these features and more for 75% OFF <<
Chaikin Analytics Review: New Member Bonuses
Subscriptions don’t just stop at the newsletter and the advanced stock and ETF ratings system.
Check out all the bonuses below.

Chaikin’s AI Power Picks
Chaikin’s AI Power Picks lists every stock the guru feels has the potential to shine during the rise of AI. These recommendations come straight out of his unique stock rating system.
Inside, you’ll get the details on each pick: company names, tickers, and info on why each opportunity is worth a closer look. Chaikin also shares buying instructions for each one.
Everything’s backed by a built-in exit strategy to help avoid pitfalls along the way.
I definitely appreciate the “why” behind each recommendation in this report. Chaikin’s system has proven itself time and again, but it’s still nice to make an educated investment.

>> Join now and get exclusive new member bonuses here <<
Tomorrow’s 10x Power Trends
AI’s the star of the show today, but it likely won’t always be.
Tomorrow’s 10x Power Trends talks about the next big trends looking to be hot tomorrow. These are future crazes no one’s even talking about yet.
The early bird gets the worm here. Buying in at the earliest stage paves the way for the biggest gains should they explode as Chaikin thinks.
It may seem too good to be true, but this is precisely what Chaikin’s Power Gauge Ratings have been doing for the past ten years.
You’ll get all this info inside this easy-to-read special report.

Top 5 Stocks to Avoid During the AI Boom
AI has its share of winning companies and its share of losers. Keeping money in the wrong stocks will sink any chance you have at a nice return.
The good news is Marc’s Power Gauge Ratings predict the duds, too. This bonus guide covers the top five stocks to avoid like the plague as the AI boom reaches the stars.
Cutting ties with these stocks as soon as possible could save you loads of pain down the road. Just last year, Marc’s list of dangerous stocks could have cost folks up to 75% of their capital.
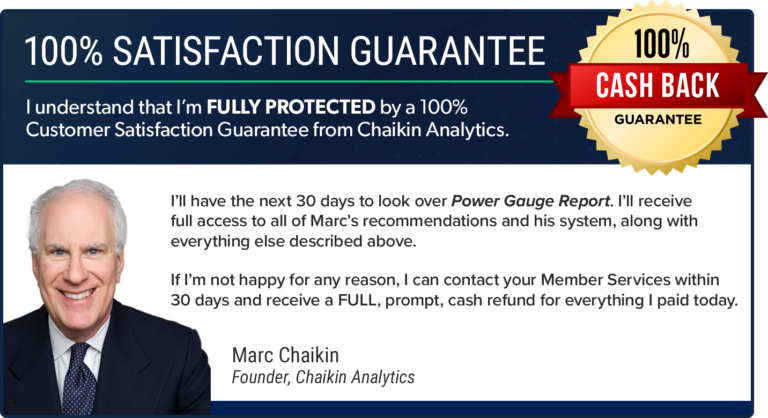
100% Satisfaction Guarantee
New Power Gauge Report members have 30 days on sign-up to take the service for a test spin.
If you decide that it’s not a good fit, you can get a refund on the subscription cost.
This typically isn’t a long enough window to see a position to its conclusion.
However, it does offer enough time to try out the advanced rating system and gauge the quality of insights.
A 30-day refund is on par with many newsletters of its kind, so I wouldn’t typically give extra points for including one.
That said, a month of access to the Power Pulse system could uncover even more opportunities than many alternative services.
>> Sign up under Marc’s guarantee <<

Is Chaikin Analytics Legit?
While doing Chaikin Analytics Review, I concluded that this platform offers a legit range of fantastic services and tools.
The company’s founder, Marc Chaikin, has been in the business for over 40 years and has built a firm reputation as a trusted analyst.
Since its inception, this publisher has amassed an impressive catalog of services that could appeal to both novices and experts.
Few companies in the investment research space have their own software to help members find their own opportunities, so Chaikin Analytics has an edge here.
Chaikin Analytics Review: Pros and Cons
During the review of Chaikin Analytics, I found out that Chaikin Analytics and its entry-level newsletter are a powerful combination, but there are some drawbacks to consider.
Pros
- Newsletter has a great price with 75% discount
- Access to advanced ratings system for an entire year
- Easy-to-use software
- Focuses on a broad range of sectors
- Stock picks include mid to large-cap stocks
Cons
- No community features
- Doesn’t include shorts or options
Power Gauge Report Pricing
An annual subscription to Power Gauge Report typically costs $199. However, Chaikin Analytics is currently running an introductory deal that drops the price tag by 75%.
This means that new members can join for just $49.
Even better, there are no trade-offs when opting to use the discount. Members receive everything mentioned in this review, including a full year of the newsletter and Power Pulse System.
All in all, this is a solid deal, especially when taking the 30-day refund period into account.
It’s important to note, however, that this is an introductory deal. The subscription renews at $199 for the next year of service.
>> Sign up now for just $49 <<

Chaikin Analytics Review: Is This Publisher Right for Me?
Chaikin Analytics’ insights are well suited for folks who prefer stock picks based on fundamental and technical indicators.
The ratings system isn’t the only metric the team uses to gauge the value of a stock. However, it’s one of the first.
For the Power Gauge Report, recommendations target companies that could perform well within a six to twelve-month period.
So anyone searching for a combo of mid to long-term recommendations is in good company.
On the other side of the coin, this newsletter is not a good fit for day trading.
Chaikin Analytics Review: Is It Worth It?
Based on a thorough Chaikin Analytics review, it is a great publisher, and its services are worth the price of admission.
The Power Gauge Report is one of the most accessible out of the lineup.
Given the introductory rate of $49 for the first year, stock picks, and access to its advanced ratings system, this suite could be a great place to test out the publisher’s insights.
Plus, it’s all backed by a 30-day refund window.
There’s a little bit of a learning curve to understanding exactly how the Power Pulse system works. But the extra resources make it a lot easier to grasp.
All in all, Chaikin Analytics and Power Gauge Report provide quality analysis.
I recommend keeping an eye on both if you’re in the market for solid insights and an easy-to-use stock-rating system.
Power Gauge Report FAQ: How the Power Gauge Rating System, Power Pulse Tool, and Introductory Pricing Actually Work
How Does the Chaikin Power Gauge Rating System Work and What Does Each Rating Mean?
The Power Gauge rates each stock or ETF across 20 factors split into four categories — Financials, Earnings, Technicals, and Experts — each with five indicators. All data points combine into one overall rating: Very Bullish, Bullish, Neutral, Bearish, or Very Bearish. Each subcategory also includes a plain-English explanation of the rating rationale, making the tool accessible regardless of experience level.
How Does the Power Pulse System Work and How Is It Different from the Monthly Newsletter Picks?
The Power Pulse System is the web-based Power Gauge tool included with your subscription — accessible from any browser, no download needed. Enter any of 4,000+ stocks or ETFs to receive an instant rating, 5-year charts, and all four subcategory breakdowns. It lets you run your own research using Marc’s system independently of the monthly newsletter picks.
How Does the Power Gauge Report Introductory Pricing and Renewal Structure Work?
New members pay $49 for the first year — a 75% discount from the $199/year regular rate with no feature trade-offs. Included: 12 monthly newsletter issues, full Power Pulse System access, the model portfolio, and all three bonus reports. The subscription renews at $199/year after the introductory period; a 30-day money-back guarantee applies.


 Tags:
Tags: