
The market is splintering, and JC Parets believes most investors have no idea which side they are on. He calls it the Chaos Cycle — a rare split where one group of stocks collapses while another quietly surges.
In this The Primary Trend review, I examine whether his Chaos Cycle framework and NOW Score system provide a realistic roadmap or just another market narrative.
JC Parets' trend-following research built around The Omen framework and the proprietary NOW Score system — immediate access to the #1 stock and Top 10 NOW list, live sessions with real-time trade alerts, and early access to the full NOW Score software, starting at $49 for the first 90 days The NOW Score software access — a proprietary 0–100 ranking system JC uses personally across thousands of charts weekly; Primary Trend members receive early access to the full tool at launch, giving them the same instrument the analyst uses behind the scenes before it is available anywhere else Brand-new service with no live portfolio track record — performance references are historical illustrations in prior market cycles, not verified live results; and the chart-heavy technical approach requires patience and some learning curve for investors less familiar with trend analysis
>> Start The Primary Trend with JC today <<

What is The Primary Trend?
The Primary Trend is the newest research service from JC Parets and TrendLabs, and it’s built around one goal: helping people follow the strongest trends in the market without getting overwhelmed.
I like JC’s big-picture approach, sharing forecasts and high-conviction trends that lead to the kind of shifts we want to be part of.
Each month, JC walks through where he believes we are in the market cycle, which areas are gaining traction, and what setups stand out right now.
You may be getting a macroeconomic scale here, but Parets does an amazing job of not overcomplicating things.
I really enjoy his simple steps that don’t require any complex moves or obscure market strategies that are hard to get behind.
Before I dive deeper into what the service has to offer, though, I want to look at the guru behind it all.
>> Unlock JC’s Primary Trend research now <<
 Who is JC Parets?

JC Parets is a seasoned market technician who built his career around understanding how trends develop long before they show up in mainstream news.
As a Chartered Market Technician (CMT), Parets mixes his insights with verified market data when searching for the biggest investment opportunities.
After a time at Westrock Advisors, JC launched All Star Charts to combine research from some of the world’s biggest technical analysts.
His success there prompted him to found TrendLabs as well, leading to The Primary Trend.
Despite being so tech-driven, I really resonate with the guru’s ability to simplify complex issues into tangible methods that any of us can pursue.
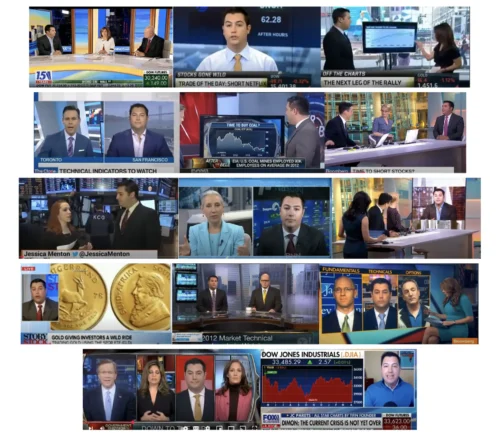
I must not be the only one with that assessment, since media outlets like Bloomberg, CNBC, and ABC consistently seek him out.
He’s also guest-lectured at institutions such as NYU, Duke, and Harvard.
>> Join JC Parets inside The Primary Trend <<
Is JC Parets Legit?
It’s clear that JC Parets has built a reputation around calling major turning points with accuracy that even seasoned analysts rarely match.
He warned about the 2008 downturn before the selloff hit, flagged the 2020 collapse almost exactly as it unfolded, and called the 2022 market bottom to the day on live television.
Those calls earned him the nickname “King of the Technicals” on Fox Business and quite a following on media outlets and otherwise.
Folks follow his work because he relies on data and price behavior instead of stories, which is why his research service carries real weight with people who track market trends.
What is TrendLabs?
TrendLabs is the research firm behind The Primary Trend and the power behind the tools, models, and market systems designed to help people follow major shifts without getting buried in noise.
The team looks beyond the noise to reveal hidden market truths that we can take bites out of, with JC leading the charge.
It’s clear to me that TrendLabs continually reinvests in itself as well. The publisher’s proprietary NOW Score, which I’ll cover in a bit, reveals a commitment to always being at the forefront of earth-shattering events.
>> Try The Primary Trend risk free <<
What Does the JC Parets Chaos Cycle Presentation Cover?
We often think of the stock market in bull- or bear-market terms, but JC Parets is pointing to something much more specific right now.
He calls it the Chaos Cycle. A rare market split that sends some stocks sharply higher while crushing others. The problem is that both sides look fine on the surface until it’s too late to move.
If Parets is right, the window to get on the correct side is open right now, which is exactly why his research deserves a closer look.
Historical Examples of the Chaos Cycle: 1890s and 1960s
JC gave me pause by sharing that this isn’t the first time a Chaos Cycle has taken place. There was a significant one in the late 1960s, when the biggest names of the time — Xerox, Polaroid, Avon, and IBM — were considered unbeatable.
Parets also points to one in the late 1890s when the railroad industry collapsed. Investors following the hype in either instance found themselves in serious trouble, while those who pivoted early multiplied their wealth.
JC attributes these cycles to chasing ideas instead of the hard assets that make those ideas a reality, which is precisely what he sees happening again today with artificial intelligence.
The 4 Phases of the Chaos Cycle Explained
According to Parets, these cycles move through four clear phases, and they can honestly take a decade to fully manifest.
In Phase 1, everything looks normal on the surface, but capital is already rotating beneath. Those adjustments lead to visible cracks in Phase 2, and a complete shift happens in Phase 3 when the previously loved positions become the biggest losers. Finally, in Phase 4, everyone rushes into the new leadership — but by that point, the best entries are long gone.
JC believes we are currently moving out of Phase 2, which means the early-mover window is closing faster than most people realize.
The Chaos Cycle creates an even split — while some stocks collapse, others rise sharply in the uncertainty. JC designed his NOW Score system to detect the winning names starting from a macro view and working down to individual recommendations.
He’s using it to locate stocks set to benefit from the current rotation, and he’s sharing that research with subscribers. Members also receive access to the scoring system itself through the Charter NOW Score software, meaning the research process is transferable rather than dependent on Parets generating every call.
The next section covers exactly what comes with a membership.
>> See JC Parets’ top picks inside <<
The Chaos Cycle Portfolio: 5 Stocks With NOW Scores in the 90s
The centerpiece of the current offer is the Chaos Cycle Portfolio — five companies Parets believes are positioned to benefit directly from the current rotation into real assets and resource-driven sectors.
What makes this different from typical recommendations is the ranking system behind them. Each company carries a NOW Score in the 90s, reflecting strong trend behavior, momentum, and relative strength relative to the broader market.
Members receive not just the tickers but also buy-up-to price levels and the technical reasoning behind each selection. It may not be a long list, but these five stocks are built to put you on the right side of the Chaos Cycle divide.
The Primary Trend Review: What Comes With It?
The Primary Trend gives you access to all these cool features that comprise JC’s full research workflow:
 The Primary Trend Monthly Newsletter and Research Service

This monthly letter is where JC lays out his full market outlook without noise.
He explains where we are in the market cycle, what the dominant trends look like, and which areas are showing strength across his technical indicators.
Each issue includes a brand new trade recommendation based on the NOW Score system, with a clear buy-up-to price and a target level so we know where to grab profits from.
I love seeing the chart setups and technical context, but as I’ve said before, JC does a great job of keeping complexity at bay.
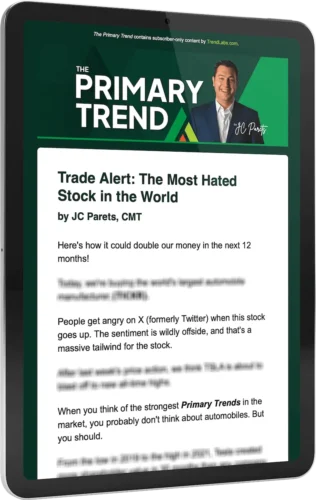
 JC’s #1 Stock for Right NOW
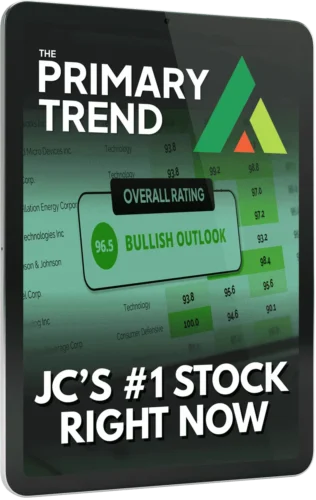
When you join, the first thing you receive is JC’s highest-ranked stock according to the NOW Score.
It’s the stock sitting at the top of his rankings based on trend strength, relative strength, and momentum.
He also explains where its climb sits relative to the current Chaos Cycle, so you understand the context behind the pick and what to watch for ahead.
You get the ticker, the score, the explanation behind it, and the full research write-up so you can understand why it ranked number one at this moment.
I received this pick immediately after signing up, so you’re not waiting for the newsletter before you can take action.
>> Get started with The Primary Trend TODAY <<
 JC’s Top 10 NOW Stocks
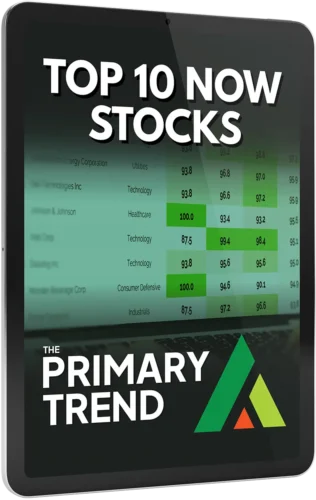
In addition to the top pick, you also gain immediate access to JC’s full Top 10 list.
These are the ten stocks with the highest NOW Scores right now, the ones meeting the criteria he measures across thousands of charts every week.
You’ll get the stock’s name and ticker symbol, making this super low-hanging fruit to start investing with The Primary Trend service.
Each stock on the list includes its ranking, the reasoning behind its score, and the technical evidence supporting its placement.
If Parets is right, multiple listings on here could surpass triple-digit gains before the next market stumble.
 The Primary Trend LIVE Video Sessions
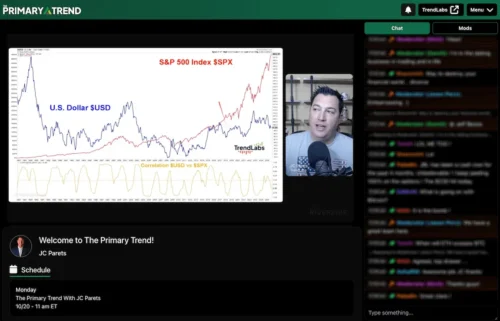
Every week, you can join JC live for an in-depth session that acts like a real-time check-in.
This is where he walks through the newest developments since the newsletter, reviews the charts that have changed shape, and highlights any fresh setups forming across the 5,000 charts he analyzes every week.
If a high-conviction trade appears in real time, JC issues the alert live on the call without making you wait for the next newsletter.
You can also submit questions through the chat and have him explain the analysis live, which adds a personal element most services never offer.
It’s essentially a weekly chance to look over his shoulder as he makes sense of the market’s behavior as it unfolds.
The Primary Trend Buy and Sell Alerts & Updates
Whenever a new opportunity appears between newsletters, JC sends a clear buy alert with exact instructions.
He also sends exit alerts when positions reach profit targets or when the trend weakens.
These alerts come to your email so you can react no matter where you are, as long as you have an internet connection.
It’s nice knowing I’m always in the know about my investments and that I don’t have to stay glued to the computer each day wondering if a shift is wiping out my wealth.
Services fall apart without this feature, and I am so thankful that Parets makes it a priority here.
>> Activate your Primary Trend membership NOW <<
 The Primary Trend Model Portfolio
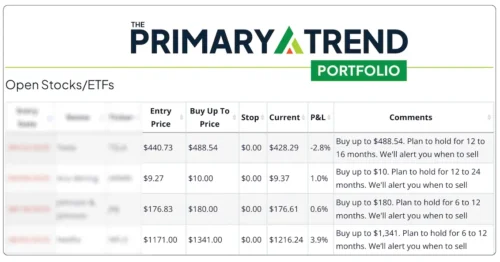
The model portfolio tracks every open recommendation inside the service in one organized dashboard.
Prices update dynamically throughout the day, so you can see the latest status of each position without digging through emails.
The portfolio details whether a position is a buy, hold, or sell, along with the research JC uses to justify each stance.
You also get access to the full trade history, the reasoning behind each decision, and the performance of past recommendations.
I enjoy hanging out here when the markets get choppy, as it’s a solid snapshot of sectors weathering the storm better than others.
JC positions the portfolio as a companion piece to the alerts, giving you clarity on exactly what he’s watching and why.
Access to JC’s NOW Score Software When It Launches
JC’s NOW Score is the backbone of the entire service, and Primary Trend members receive early access to the full software once it rolls out.
The system ranks sectors, industries, and individual stocks using three technical metrics: trend strength, relative strength, and momentum.
This is a huge win for subscribers, since JC has been keeping this to himself up until this point. Once it rolls out, we’ll be able to do the same comparative testing as the guru himself.
On the inside, you’ll be able to see scores, compare opportunities, and sort through thousands of assets with the same tool JC uses behind the scenes.
>> Follow JC Parets’ market roadmap now <<
The Primary Trend Bonuses
You’ll also get access to all these bonuses simply by signing up:
Special Report #1: The Chaos Cycle Playbook
The Chaos Cycle Playbook is the strategic blueprint behind Parets’ entire thesis. Inside, you’ll see how the four phases of a chaos cycle play out and the effect it’s had on investors for over a century.
You’ll see exactly where we are in the current pattern so you can prepare and not get caught off-guard when the split fully reveals itself.
There are no stock recommendations here, but having this context clarifies the repeat patterns that help you survive major market rotations.
Reading it gives you a look under the market’s hood and the ability to spot these uncertain periods independently.
Special Report #2: The Burn File (10 Critical Sells)
The Burn File focuses on what Parets considers the most overlooked part of navigating a market rotation: knowing what not to own.
This report highlights ten stocks currently showing the weakest technical leadership based on low NOW Scores, signaling deteriorating trend behavior, weak relative strength, and fading momentum.
What makes it particularly practical is how it encourages you to review your existing holdings rather than only looking for new opportunities.
Think of it as a portfolio risk check that highlights areas of weakness likely to put you on the wrong side of the next major rotation.
JC’s Primary Trend Handbook

This handbook shares a deeper explanation of how JC reads the market through trend analysis.
He breaks down the principles behind his approach, including how he evaluates long-term market direction, how he studies strength across sectors, and why focusing on the Primary Trend removes the guesswork from investing.
You’ll also get the logic behind the NOW Theory and how it ties into the rankings members see inside the service.
By the time you finish, you understand the rhythm behind market cycles and why identifying the Primary Trend early can change how you approach every decision you make inside your portfolio.
I think of this like a window into JC’s mind and all the insight he’s picked up over the years. Few gurus play their cards like this, making it a huge win in my book.
The NOW Score System Primer
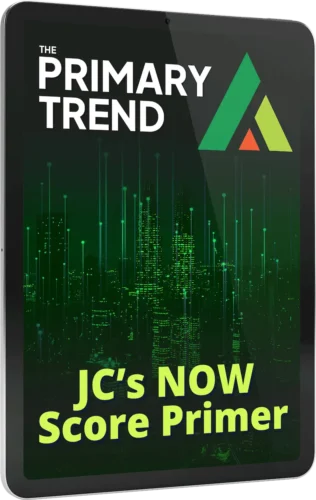
The NOW Score is a core part of The Primary Trend, and this guide explains exactly how it works. JC outlines how each stock is measured using three technical pillars: trend strength, relative strength, and momentum.
He shows how combining these elements creates a ranking system that helps narrow thousands of stocks down to the few that matter most right now.
Once inside, I learned how to interpret the score itself, compare rankings across sectors and industries, and use the data to spot names that could benefit from current conditions.
The NOW Score measures the healthiest areas of the market in real time, and this is the inside scoop on how it all works.
By understanding how the score is built, the rankings you receive in the service feel far more useful and intuitive.
>> Follow JC Parets’ guidance today <<
JC’s BOTTOM 10 NOW Stocks
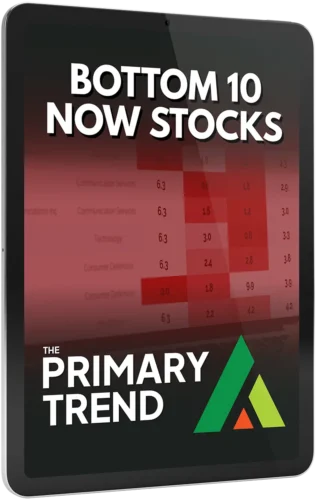
This ongoing feature is the flip side of JC’s Top 10 list and updates regularly as scores change. Unlike The Burn File, which highlights the ten specific sells most at risk during the current Chaos Cycle rotation, the Bottom 10 is a dynamic list covering the weakest-scoring stocks across the entire NOW Score system at any given time.
These are the names showing weak participation, deteriorating momentum, and poor relative strength compared to the rest of the market.
JC explains why these scores matter just as much as the top rankings. When a stock consistently appears at the bottom of the list, it often signals deeper structural issues that most investors won’t see until the decline becomes obvious.
It’s a data-minded approach to what to avoid, even if you don’t want to understand all the factors behind it. They’re here if you do.
JC encourages members to treat this list as a form of early warning, especially heading into a period where market structure matters more than headlines.
Access to JC’s Top 10 Charts
Every two weeks, JC sends members a curated list of the ten charts he believes deserve the closest attention right now.
Beyond simple snapshots, each chart comes with context that explains why the setup matters, what signals he’s watching, and how the trend could evolve.
As a visual learner, these graphs speak loud and clear to me about trends I want to keep an eye on.
You get to see the price action the same way JC does, including breakouts forming, momentum shifts taking shape, or areas of the market where money is rotating.
 The 5-Part Primary Trend Video Starter Guide

This video series gives you a structured introduction to JC’s entire approach, and where I’d recommend you start your journey.
Instead of throwing you into the service immediately, he walks through the core ideas that drive his research, including trend identification, top-down market analysis, sector rotation, and the role of NOW Theory.
The videos were selected from JC’s most valuable teachings, making it a quick way to understand the framework he uses each day.
What helps most is how he explains each concept with real chart examples so you can see how the theory plays out in practice.
Whether you’re brand new to technical analysis or want a refresher before diving deeper, the series offers a smooth starting point.
>> Tap into JC’s trend insights now <<
 Access to The Lab Training
The Lab is where JC shifts from research to hands-on education. These weekly sessions give you the chance to learn directly from him as he teaches the deeper parts of technical analysis.
In a sense, JC is sharing the strategies that have made him so successful.
These topics often go well below surface level, so don’t be surprised if a few points fly over your head. That’s normal.
Over time, you’ll warm up to how Parets conveys this information and in turn will build your own pool of knowledge.
In my experience, there’s not an off-limit topic here, so I watch faithfully to pick up insights from futures to crypto.
You can ask questions during the session, which adds a level of clarity you rarely find in most research services.
>> Join The Primary Trend before prices rise <<
 Refund Policy

TrendLabs backs The Primary Trend with what JC Parets calls the “Sleep Soundly” 30-day Guarantee.
You have a full month to read the newsletters, watch the live sessions, explore the model portfolio, and even paper-test a few of JC’s recommendations.
If at any point within those first 30 days you feel the service isn’t a good fit, you can email or call the support team and request a refund.
They make it clear that no explanation is required. It creates a low-pressure way to experience the research before continuing with the subscription.
Here is my balanced view of the service after reviewing everything.Pros and Cons
Pros
Cons
The Primary Trend Track Record and Past Performance
Since The Primary Trend is a brand-new research service, it does not yet have a performance history or model portfolio track record for me to evaluate.
However, the materials emphasize JC’s long career of identifying major market turning points and spotting strength early.
He warned followers ahead of the 2008 decline, called the 2022 market bottom live on television, and ahead of the 2020 COVID crash flagged elevated equity risk and suggested rotating out of technology and into bonds before the selloff hit — a call that reflected the same relative-strength and trend-behavior analysis that drives the NOW Score system today.
That call reflected the same relative-strength and trend-behavior analysis that drives the NOW Score system today.
TrendLabs also points to historical backtests showing the NOW Score framework would have surfaced significant commodity and resource leaders during the 1999–2011 Chaos Cycle, though these are illustrations rather than verified portfolio results.
>> Access JC’s NOW Score insights today <<
How Much Does The Primary Trend Cost?
The Primary Trend is available under a Charter Member discount that lowers the cost far below its $499 annual retail value.
New members can start with the quarterly plan for $49 today, which covers the first 90 days of full access to the research, the live sessions, the model portfolio, the Top 10 NOW Stocks, and all bonuses.
After the initial period, the subscription renews at $99 every quarter.
There is also a discounted annual option for $297, which offers the most savings for people who prefer paying once per year.
You’ll only pay this lower rate next year when it’s time to renew, meaning you can save a lot of money in the long run by getting in now.
>> Start tracking trends with JC Parets <<
 Is The Primary Trend Worth It?

After going through all the material, I think The Primary Trend delivers real value for anyone who wants a structured way to follow the strongest trends without guessing what the market is doing.
JC Parets combines clear research with a system that removes a lot of the emotional noise most people struggle with.
The mix of monthly guidance, real-time alerts, educational sessions, and the upcoming NOW Score software creates a package that feels far more complete than a typical newsletter.
The introductory pricing also makes it easier to test everything without a high upfront cost.
Based on everything covered in this The Primary Trend review, it’s a solid choice if you want clarity heading into the next market cycle.
If you’re tired of watching market rotations unfold after the fact, the Chaos Cycle framework gives you a structured way to position ahead of the next one. Grab the Charter bundle while the pricing and bonuses are still in place.
The Primary Trend FAQs
What Are the Four Phases of the Chaos Cycle, and How Does JC Parets Identify Which Phase We’re In Now?
The Chaos Cycle framework is JC Parets’ model for understanding how major market rotations unfold, not as sudden crashes or bull runs, but as multi-year structural shifts moving through four distinct phases. Phase 1 is the stealth phase, where surface conditions look normal but capital is quietly rotating away from previously dominant sectors. Phase 2 is when visible cracks appear… a few leading stocks begin underperforming in ways that are hard to explain away. Phase 3 is the shift phase, when broad recognition occurs that the prior leadership cycle has ended; the stocks people held most confidently suddenly create the most damage. Phase 4 is the crowding phase, when capital floods into the new leadership sectors, but the initial opportunity window has largely closed.
Parets argues we are currently moving out of Phase 2, drawing parallels to the late 1960s when Xerox and IBM dominated the same way Nvidia and the Magnificent Seven dominate today, and to the late 1890s railroad boom when infrastructure investment ran far ahead of economic reality. His case is that these cycles are identifiable in advance through technical leadership signals, specifically, the relative strength and momentum metrics that the NOW Score system is designed to detect.
How Does the NOW Score System Work and What Does a Score in the 90s Actually Mean for a Stock?
The NOW Score is JC Parets’ proprietary 0–100 ranking system evaluating stocks across three dimensions: momentum, relative strength, and trend behavior.
A score of 0 represents the weakest possible technical profile: deteriorating momentum, underperformance against benchmarks, and a trend breaking down.
A score of 100 represents the strongest profile: accelerating momentum, consistent outperformance relative to the broader market and its sector, and a trend that is clearly intact and strengthening.
A score in the 90s, where all five Chaos Cycle Portfolio picks sit, means a stock is exhibiting some of the strongest momentum, relative strength, and trend characteristics in the entire market at the time of scoring.
These are not necessarily the most well-known names; they are the ones where technical data suggests institutional accumulation is underway and leadership is developing ahead of broader market recognition. What makes the Charter NOW Score software significant is that it gives members the ability to query any ticker independently and receive the same output Parets uses himself; the research process becomes transferable rather than dependent on his generating every recommendation.
How Does the Charter Member Pricing Work and What Is the Difference Between the Quarterly and Annual Plans?
The charter member pricing is an introductory offer for people joining The Primary Trend early in the service’s launch phase. The quarterly plan starts at $49 for the first 90 days, well below the $499 stated retail value, and renews at $99 per quarter after the initial period. The annual plan offers a lower effective per-year cost at $297, which works out to roughly $74.25 per quarter compared to the $99 quarterly renewal rate.
Both plans include identical access to all membership features, bonus reports, live sessions, alerts, and the model portfolio. The main difference is payment timing and total annual cost. The quarterly plan offers a lower entry barrier, while the annual plan locks in meaningful savings for anyone confident they want to continue beyond the first 90 days. The 30-day Sleep Soundly Guarantee applies to both plans.


 Tags:
Tags: