

A high yield can look attractive, but weak cash flow can quickly turn reliable income into a costly mistake, while a fast-rising stock may offer little long-term stability.
To solve that problem, Seeking Alpha built its brand new Quant Growth & Income Portfolio as a dividend-based service that uses quantitative ratings to find dividend-paying companies with a stronger balance of income, quality, and capital appreciation.
In this Quant Growth & Income Portfolio review, I’ll examine the strategy, performance, risks, price, and overall value.
>> Join Seeking Alpha’s Quant Growth & Income Portfolio <<

What Is Quant Growth & Income Portfolio?
Quant Growth & Income Portfolio combines Seeking Alpha's proven Quant Ratings with Dividend Safety Grades to identify dividend stocks offering both reliable income and long-term capital appreciation. Its rules-based methodology removes emotion while providing a diversified, actively maintained model portfolio. Unlike traditional dividend strategies focused solely on yield, QG&I evaluates nine quantitative factors, including profitability, momentum, earnings revisions, and dividend safety. The portfolio also targets outperforming Vanguard's VYM ETF while maintaining a comparable dividend yield. Quant Growth & Income Portfolio is designed for investors willing to manage their own brokerage account and follow periodic trade alerts. Its disciplined approach favors long-term dividend investing over passive index investing or short-term trading.
Quant Growth & Income Portfolio is a brand new rules-based research service from Seeking Alpha built for people who want dividend income without giving up the chance for meaningful share-price growth.
Its central idea is simple: a strong income strategy should not rely on yield alone.
The platform looks for dividend-paying companies that also score well in other categories, such as profitability and company momentum.
As a member, you receive access to a model portfolio holding up to 30 stocks, including U.S. companies, ADRs, REITs, and select smaller businesses.
The service also includes stock alerts, regular portfolio updates, position weights, ongoing analysis, and a complete history of past changes.
Seeking Alpha designed the portfolio to outperform Vanguard’s VYM ETF in total return while keeping its dividend yield in a similar range.
It also uses Dividend Safety Grades to reduce exposure to companies that may cut their payouts.
That mix of income, growth, and discipline is a powerful reason readers may find Quant Growth & Income Portfolio worth exploring.
Is Quant Growth & Income Portfolio Legit?
Yes, Quant Growth & Income Portfolio is a legitimate financial research service from Seeking Alpha.
The company pooled several powerful minds together to create this new service, adding to the plethora of tools already at its disposal.
It follows clear selection and sell rules, tracks performance against the VYM ETF, and gives members access to current holdings, position weights, trade alerts, analysis, and portfolio history.
Seeking Alpha itself has been around for more than 20 years and is a huge name in investing.
I also like that Seeking Alpha clearly presents the Quant Growth & Income Portfolio as a model portfolio rather than a managed account.
The main limitation is its short live track record, since much of the long-term performance case still relies on backtesting.
Overall, the service feels transparent, structured, and credible.
>> Explore Quant Growth & Income Today <<
Who Is Steven Cress? The Seeking Alpha Quant Team Behind QG&I
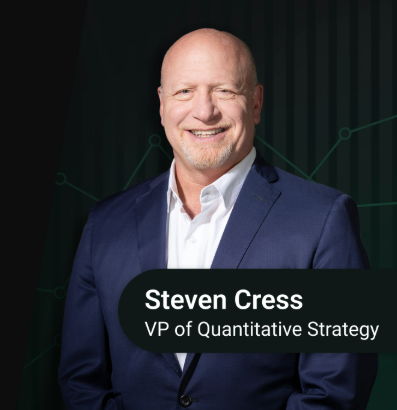
Seeking Alpha’s Quant Team manages Quant Growth & Income Portfolio, led by Steven Cress and supported by Kevin Sanford.
Cress has more than 35 years of experience across Morgan Stanley, Northern Trust, hedge fund management, and financial technology.
He also created the research system that became the foundation for Seeking Alpha’s Quant Ratings, Dividend Safety Grades, REIT Grades, and related tools after the company acquired his firm.
Sanford brings experience in banking analysis, portfolio research, and income strategies, along with an MBA from the University of Maryland.
Their combined backgrounds give the service real credibility.
How the Quant Growth & Income Strategy Selects Dividend Stocks
The research team describes its approach as “quantamental”, combining quantitative analysis with fundamental company research.
Rather than relying on one analyst’s opinion, QG&I uses financial data, mathematical models, and sector-relative comparisons to rank potential holdings.
The process begins with Seeking Alpha’s broader Quant Ratings system.
It then adds dividend-specific standards to create a rules-based dividend portfolio centered on both total return and income generation.
A Daily Quant Rating Screen
Seeking Alpha’s Quant system evaluates close to 5,000 stocks.
Fresh data enters the model each day, from financial statements to market prices, analyst estimates, and company-specific metrics.
The system reviews updated income statements, balance sheets, and cash flow statements for notable changes, since a company’s financial position can change quickly.
A strong quarterly report may improve earnings expectations, while a weak filing can expose declining profitability or rising debt.
Seeking Alpha uses the data to rank companies from strongest to weakest, creating a literal list from 1 to 5,000.
It also compares stocks with others in the same sector rather than applying identical standards across every industry, giving a more realistic scope for each one.
>> Start With Quant Growth & Income <<
The Nine Factors Behind Each Selection
The QG&I methodology considers nine main characteristics: valuation, growth, profitability, momentum, earnings revisions, dividend safety, dividend growth, yield, and payout consistency.
Each metric serves an important purpose in the overall mix, showing a company’s strengths and weaknesses from multiple sides at one time.
The result is a data-driven dividend strategy that looks beyond one attractive percentage.
A stock needs a broader combination of financial quality, favorable market signals, and payout strength before it can qualify.
Being able to sort through this data quickly helps frame up potential investment opportunities or raise red flags about a company you were considering without you having to dive deep into the numbers.
Why Dividend Safety Matters
A dividend stock can look safe right up until the payment disappears from underneath you.
That’s why Seeking Alpha created its Dividend Safety Grades to help identify warning signs before a cut or suspension occurs.
The system reviews several underlying metrics, such as payout ratios, free cash flow, dividend coverage, and sustainable growth.
Through backtesting, Seeking Alpha found that 91% of stocks that cut their dividends carried a Dividend Safety Grade between F and C+.
Those figures do not mean every low-graded stock will reduce its dividend, just as they do not guarantee that an A-rated company will keep paying.
However, Dividend Safety Grades can provide useful directional evidence.
>> Access Seeking Alpha’s QG&I Portfolio <<
What Allows a Stock to Enter the Portfolio?
A company must pay an active dividend, meet Seeking Alpha’s Dividend Growth, Dividend Safety, and Dividend Yield standards, maintain a Buy or Strong Buy Quant Rating, and average at least $400 million in market value.
New positions usually enter at about a 3.33% weight, which helps keep the portfolio balanced while giving each holding enough room to contribute.
I appreciate the rules being clean-cut so you know precisely what you’re walking into.
When Does QG&I Sell a Stock?
QG&I removes a holding when its Quant Rating drops to Sell or Strong Sell, stays at Hold for too long, or its Dividend Safety Grade falls to D or lower.
A dividend cut, suspended payout, delayed financial filing, or major merger can also trigger an exit.
I found the sell rules especially useful because they reduce guesswork and keep emotion out of portfolio decisions.
>> Join Seeking Alpha’s Quant Growth & Income Portfolio <<
Portfolio Size, Weighting, and Rebalancing
Quant Growth & Income Portfolio holds up to 30 U.S. stocks, foreign companies with U.S. listings, REITs, and qualifying small-cap companies.
The team reviews the model every other Wednesday and averages about two stock changes per update.
Some periods bring no changes, while sharper market shifts can lead to several.
You place your own trades, so personal prices and returns may differ from the model.
Overall, the schedule feels active enough to respond to changing data without becoming difficult to manage.
What Comes With Quant Growth & Income Portfolio?
A subscription gives members the research, portfolio data, and ongoing instructions needed to follow the strategy.
Complete 30-Stock Model Portfolio
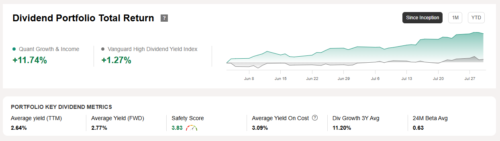
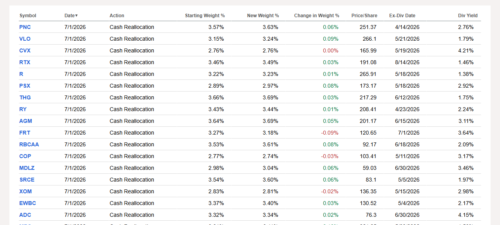
The model portfolio is the main feature of the service, and you’re free to check out each holding and its current weight allocation at any time.
Seeking Alpha also shows portfolio-wide performance and its comparison with the Vanguard High-Dividend Yield ETF (VYM).
You’ll never see more than 30 stocks in here at any given time, but there’s no requirement to keep exactly 30 in the portfolio if the market isn’t playing nice.
Each holding has passed the Quant and dividend requirements in effect at the time of entry.
That makes the portfolio useful if you like individual dividend stocks but do not have the time or tools to screen thousands of companies.
>> Unlock Quant Growth & Income <<
Biweekly Trade Alerts
Seeking Alpha publishes portfolio changes every two weeks on Wednesday at 1:00 p.m. Eastern, sharing what’s on the way in or out.That regular schedule makes the service easier to plan around, so you’re not having to watch a computer screen all day waiting for an update.
The model averages about two stock changes per review, though activity can move above or below that level.
At the end of the day though, it’s entirely up to you whether to follow an alert.
Quant Team Analysis
The Quant Team publishes research alongside the portfolio updates, offering more than a ticker and target weight.
It can explain the data behind a change, the strength of a company’s factors, and the role of the stock within the dividend growth model portfolio.
This is especially helpful when you don’t immediately recognize the name of a recommendation.
A smaller company or foreign ADR may not receive the same media coverage as a household name.
Seeing the valuation, profitability, momentum, earnings revisions, and dividend profile can make the selection easier to assess.
The commentary also helps you understand the strategy instead of following alerts without knowing why a stock qualified.
>> Explore Quant Growth & Income Portfolio <<
Portfolio History
QG&I includes a Portfolio History tab that records every buy, sell, and rebalance decision since inception.
You can use the history to review when a company entered, how long it remained, and why the portfolio changed.
I’m a huge fan of the transparency this gives, since so many services hide behind their biggest wins.
A full transaction history makes it easier to judge the complete process.
The historical record also helps new members understand how active the model has been before they attempt to follow it.
VYM Benchmark Tracking
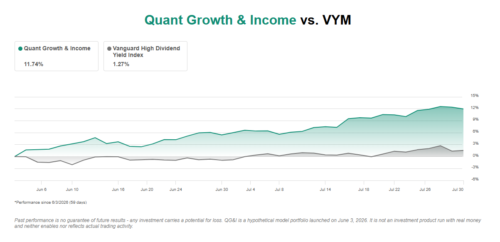
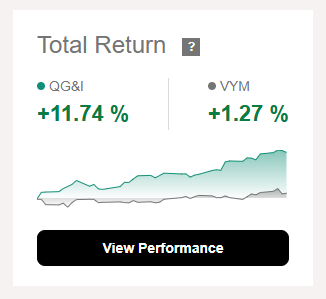
QG&I displays its results against the Vanguard High Dividend Yield ETF, which is the most comparable basket of holdings to what Seeking Alpha is trying to do here.
The service’s stated objective is to beat VYM in total return while keeping the QG&I yield within a close range.
This way, you can monitor whether the service is moving toward that goal instead of relying on broad claims.
>> Join Seeking Alpha’s Dividend Portfolio <<
How Is QG&I Performance Calculated?
Seeking Alpha calculates Quant Growth & Income Portfolio performance through a notional buy-and-sell process that started on June 3rd.
The model does not contain real money; it simply records simulated transactions based on the published portfolio decisions.
To calculate, the methodology uses volume-weighted average prices on purchase and sale dates, according to the supplied product material.
Dividends are notionally reinvested into the stock that paid them.
When a dividend arrives from a security that has already left the model, the payment is spread across the current holdings.
QG&I reports time-weighted returns, removing the effects of external cash flows and is commonly used to compare portfolio management results.
Models are great because they can show whether the strategy rules worked under the listed assumptions, but this is not a direct correlation to what members earn.
Personal results may differ because of execution prices, delayed trades, bid-ask spreads, taxes, position sizing, or a decision to follow only part of the portfolio.
>> Get QG&I For Your Portfolio <<
QG&I Did Not Outperform Every Year
The backtest included two years when QG&I underperformed VYM, during the two years when the pandemic was in full swing.
Cress explained that fearful markets can cause people to sell strong companies to raise cash.
Stocks with solid fundamentals and positive momentum may fall alongside weaker businesses during those rotations.
The model later recovered and beat its benchmark across the following three years.
QG&I posted annual gains of 15.92%, 24.5%, and 24.96% during that stretch. Its yearly outperformance reached 9.3, 8, and 8.7 percentage points.
Including those weaker years gives the backtest more credibility, as I’ve never seen a strategy lead in every market.
QG&I may fall behind during periods when defensive assets or broad index exposure attract more demand.
You’ll want a long-term view and enough patience to follow the rules through those stretches.
Dividend Yield and Dividend Safety
QG&I aims to produce a competitive dividend yield without building the portfolio around the largest payouts.
A high yield can result from a strong dividend policy, but it can also reflect a falling share price and declining confidence in the business.
Seeking Alpha looks for sustainable dividends supported by healthy balance sheets, good cash flow, suitable payout ratios, and continued business strength.
Individual holdings can carry different yields. Some may pay close to 1%, while others may reach around 6%.
Seeking Alpha wants its overall yield to remain in a close range of VYM while producing stronger capital appreciation.
That gives QG&I more freedom to include a lower-yielding company when its dividend growth and return outlook appear stronger.
REITs can also enter the model. Seeking Alpha evaluates them through REIT-specific grades because their accounting and distribution structures differ from those of traditional corporations.
I prefer this balanced approach to a pure high-yield screen.
A safe 3% payout with earnings growth can create better long-term value than an unstable 9% dividend backed by weak cash flow.
>> Explore Quant Growth & Income Portfolio <<
Who Is Quant Growth & Income Portfolio Best For?
QG&I makes the most sense for someone who wants to build a diversified portfolio of individual dividend stocks but does not want to complete every screen and financial comparison alone.
The service could suit individuals who value a repeatable process.
Its entry and exit rules reduce the need to make decisions based on market headlines or emotion.
You’ll also want to feel comfortable owning up to 30 individual positions.
It’s important to review trade alerts every few weeks and place orders through a brokerage account.
People approaching retirement may appreciate the focus on dividend consistency and reduced exposure to payout cuts, while younger members may value the balance between current income and long-term appreciation.
There are several facets you can sink your teeth into here, but it won’t be for fast-paced trades or someone looking for a fully managed account.
I’ve spent quite some time testing out the Quant Growth & Income Portfolio, and these were the top pros and cons I came up with:Pros and Cons
Pros
Cons
How Much Does Quant Growth & Income Portfolio Cost?
Quant Growth & Income Portfolio costs $449 for the first year, which reflects a $50 discount from the standard $499 annual price.
After the first year, the subscription renews at the regular annual rate in effect at that time.
The current renewal price is $499 per year, plus any applicable sales tax or VAT.
For that price, you get full access to the model portfolio, stock alerts, Quant Team analysis, performance tracking, and portfolio history.
The fee does not cover the stocks themselves, brokerage costs, taxes, or any other Seeking Alpha subscription.
I’d also keep the auto-renewal date in mind, since the plan bills annually unless canceled beforehand.
>> Join Seeking Alpha’s Quant Growth & Income Portfolio <<
Is Quant Growth & Income Portfolio Worth It?
Based on my experience with the service, Quant Growth & Income Portfolio is worth considering for anyone who wants dividend income without giving up long-term growth potential.
Seeking Alpha has built a practical system around Quant Ratings, portfolio discipline, and its Dividend Safety Grade, which helps filter out weaker payouts before they become a bigger problem.
Created from the ground up, this brand new product stands as a powerful complement to what Seeking Alpha already has on the table.
The service is not ideal for someone who wants a fully passive setup, since members still need to follow alerts and place their own trades.
Still, the structure saves a great deal of research time.
As this Quant Growth & Income Portfolio review shows, the real value comes from having a clear process for finding, tracking, and removing dividend stocks.



 Tags:
Tags: