

We’re all aware of the wealth-building potential the market brings, but few of us have the time required to hunt down strong opportunities and position ourselves with real confidence.
That’s where Stock Rover comes in.
The platform claims to save you time on research, help you make sharper assessments, and give you the tools to build a stronger financial foundation.
In this Stock Rover review, I’ll walk you through what I discovered after testing the newest version of its platform and reviewing its latest updates.
>> Try Stock Rover Premium Today <<
What Is Stock Rover?

Stock Rover is a stock screener and market research platform built for people who want deeper data without spending hours jumping between spreadsheets, broker dashboards, and financial websites.
Its toolkit covers detailed stock reports, Stock Rover Ratings, portfolio analysis and management, custom screeners, watchlists, alerts, charting, brokerage integration, analyst ratings, insider transactions, and downloadable research reports.
The new version expands the dashboard, adds more data, introduces two professional-grade tiers, and gives serious users more room to build portfolios, watchlists, and screeners.
Even better, Stock Rover still supports brokerage integration. You can also set up your portfolio manually if you do not want to connect outside accounts.
Recent updates also deepen the portfolio side with redesigned performance analytics and a new Portfolio Performance Report.
What I like most is that Stock Rover does not feel like a loose pile of tools. The platform has a clear purpose: help users make better research decisions with better data.
Let’s dig deeper into what the platform can do.
Stock Rover centralizes stock screening, portfolio analytics, brokerage integration, and research reports into one platform — replacing several standalone tools and delivering unmatched research depth for fundamental, long-term analysis at a price well below competing all-in-one platforms. The Premium Plus tier's combination of 650+ screening metrics, unlimited custom fields, correlation analysis, future dividend income projections, and the Trade Evaluator makes this one of the most comprehensively customizable self-directed research platforms available at under $28/month. Stock Rover is purpose-built for long-term, fundamental analysis of North American stocks and ETFs. Traders wanting crypto, options, forex, international market coverage, or the ability to execute trades directly from the platform will need a supplementary or alternative tool.
Is Stock Rover Legit?
Stock Rover is a legit screener and research hub that provides valuable data for market research, portfolio tracking, and stock analysis.
I can count on one hand the number of other platforms that offer this much functionality in one place.
These are not random features added just to make the sales page longer. Each tool feels deliberate. The screener, charting, ratings, alerts, reports, and portfolio tools all work together.
That is a big reason I still view Stock Rover as one of the better research platforms for people who want to study stocks with a long-term lens.
New upgrades strengthen the portfolio side as well, giving users better tools for measuring returns, risk, cash flow, diversification, and the actual sources of wealth creation that pull from 20 years of historical fundamentals.
It is not the simplest stock tool on the market, but if you want depth, Stock Rover is the real deal.
Is Stock Rover Safe?
Stock Rover is not a trading app and does not control your money. That alone lowers the risk compared with platforms that connect directly to trading execution.
The platform is built for research, screening, portfolio tracking, and analysis.
According to the company’s own FAQ, its data centers are locked and accessible only to authorized personnel. The platform also says its servers are protected by multiple firewall layers.
That means hackers cannot use Stock Rover to place trades or empty your brokerage account.
The platform also says it does not sell your email address to third parties. It uses your email to communicate with you about your account.
I still recommend using strong passwords and two-factor security wherever possible.
But overall, I did not see any red flags that would make me uncomfortable using Stock Rover as a research platform.
>> Already sold? sign up now <<
Is There a Stock Rover App for Mobile or Tablet?
Stock Rover works on desktop, mobile, and tablet, but it does not have a dedicated app in the Apple App Store or Google Play.
So you cannot download a standalone Stock Rover app the way you would with a broker or banking platform.
That said, the platform offers an optimized interface when you log in on a phone or tablet.
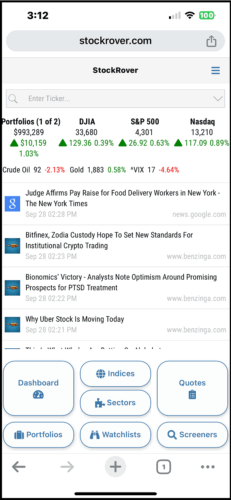
I do not think this is ideal. A dedicated mobile app would feel smoother.
But the browser-based mobile version gets the job done when you need to check your data away from your desk.
For deep screening, chart work, and portfolio analysis, I would still use the desktop version.
For quick checks, the mobile interface is fine.
>> Try Stock Rover on Mobile Today <<
Does Stock Rover Provide Real-Time Market Data?
Market data changes fast, and Stock Rover does a solid job keeping its numbers current.
The platform updates price quotes on NYSE and NASDAQ stocks with minimal delay. In many cases, the delay is less than a few seconds.
More obscure stocks can take longer.
If you are checking activity outside major exchanges, the delay may be around five minutes. Canadian stocks and micro-caps can be delayed by around 15 minutes.
All paid plans can enable Auto Refresh, which updates the Stock Rover display as often as once per minute.
This is useful if you actively monitor holdings throughout the day.
That said, Stock Rover is not a pure day-trading terminal. It is best seen as a research and portfolio analysis hub.
If you need instant order execution, you still need a brokerage platform.
How Does Stock Rover Work?
In my experience, Stock Rover makes it easy to gather stock data, compare companies, and analyze portfolio performance.
The platform carries pricing data for roughly 14,000 stocks across major North American markets, including the NYSE, NASDAQ, and OTCBB and OTCPK securities.
If that wasn’t enough, you can also get data on 7,400+ ETFs, and 40,000+ mutual funds.
From there, the sky’s pretty much the limit on what you can do. Use Stock Rover to compare stocks and ETFs, manage your portfolio, review ratings, or run screens… and that’s just scraping the surface.
With so many features, the dashboard is one of the biggest strengths.
The newest version of Stock Rover makes things even easier by consolidating information and making better use of screen space.
You don’t have to abandon the old setup if you’re an existing user, since Stock Rover still lets you toggle back to the Classic Dashboard.
>> Join Stock Rover for Free and Enjoy 14 Days of Premium Plus <<
What Is Stock Rover V12?
Stock Rover V12 launched on May 31, 2026, and it’s a doozy.
It introduced a rebuilt website, expanded dashboard tools, new professional plans, more data, more screeners, options support, advanced charting, and higher limits for power users.
Stock Rover has continued refining those additions since launch, especially around screening, portfolio reporting, and the Dashboard experience.
There’s really never a dull moment here.
A Better Website Experience
The newest version rebuilt the website, and the company has continued refreshing its key landing pages since then.
It’s crisper, cleaner, and does a better job explaining how Stock Rover brings research and portfolio tracking together.
The refreshed Why Stock Rover and Portfolio Management pages focus more clearly on that unified workflow, while the new How We Compare hub gives visitors a direct way to see how Stock Rover stacks up against competing platforms.
I also like what Stock Rover has done with its Screener Strategies page.
The new “Describe a Screener. Stock Rover Builds It.” experience lowers the barrier for people who know the type of company they want to find but do not necessarily know which financial filters to enter.
These website changes do not alter the underlying product, but they make a complex platform easier to understand before you ever sign up.
Expanded Dashboard Tools
V12 first expanded the Dashboard with dedicated Analyst Ratings, Insider Transactions, and Crypto summaries.
Since then, I’ve seen a completely redesigned Dashboard built around a cleaner layout and more efficient widgets.
The new workspace provides a broader market view while bringing portfolio-level information closer to the surface.
The right-side rail keeps actionable information such as alerts, upcoming earnings, projected income, and relevant news within easy reach.
You can also toggle some widgets on or off so you don’t have to look at data points you’re not interested in.
All in all, I find it an impressive boost to an already solid dashboard experience.
New Professional Tiers
The new Ultimate and Ultimate Pro tiers are the biggest changes in V12.
These plans are built for serious users who need more scale, more data, and deeper analysis.
On the inside, you’ve got 20 years of historical fundamentals, percentile screening, expanded data limits, and much higher capacities for portfolios, watchlists, and screeners.
Ultimate allows up to 120 screeners, 60 portfolios, and 120 watchlists.
Ultimate Pro pushes those limits much higher, with up to 1,000 screeners, 300 portfolios, and 1,000 watchlists.
Admittedly, most casual users will not need those limits. But for power users, advisors, data-heavy researchers, and people who manage several account types, this makes Stock Rover much more flexible.
Standalone Research Facilities
V12 also introduces standalone environments for Analyst Ratings and Insider Transactions.
These detachable windows give Ultimate and Ultimate Pro users more space to run deeper research.
I like this addition because it fits the way people actually research.
Sometimes you want to study analyst upgrades and downgrades without crowding the main dashboard. Other times, you want to track insider buying and selling while keeping a chart or portfolio view open.
Detachable windows make that workflow easier.
Option Support
This is one of the most important updates in V12.
Ultimate and Ultimate Pro users now get dedicated options support through a fully integrated Options Chain in the Insight Panel.
The integrated Options Chain supports expiration-based research, contract charting, options trade management, and options pricing directly inside portfolios.
Stock Rover now supports options research and portfolio pricing for Ultimate and Ultimate Pro users, but I’m not sold that there’s enough here for advanced options work.
Advanced Charting
The V12 charting engine also adds several useful tools.
Ultimate users can now overlay Analyst Ratings directly on price charts. This helps show how analyst changes line up with stock movement.
You can also set custom chart series colors and add trendlines alongside drawing tools to fit your style.
I spend a lot of time in charting tools, and this update makes sense.
Stock Rover has always been stronger on fundamentals than short-term charting. But these new tools help bridge that gap.
You still should not confuse it with a pure trading chart platform.
But for research, comparison, and trend study, the upgraded charting engine looks like a strong step forward.
Data Engine Expansion
V12 brings 104 new metrics and nearly 80 new screeners to the Investor Library, which is a huge jump.
The old platform already had a deep set of screeners and metrics. Adding this much more data gives users more ways to find stocks that match their exact strategy.
For example, you can screen by valuation, dividend quality, growth, analyst sentiment, profitability, balance sheet strength, or market performance.
With percentile screening in the higher tiers, users can also compare stocks against peers in a more refined way.
That helps turn raw data into better context.
>> Try Stock Rover Ultimate Today <<
Stock Rover Features Breakdown
Stock Rover’s feature set covers an absolute ton of features that you can dive into, with recent portfolio updates now adding much deeper performance reporting on top of that foundation.
Keep reading my Stock Rover review to find out more about each one.
Stock Screening Tools
Stock Rover’s built-in stock screener is a great resource for identifying new trade and investment ideas.
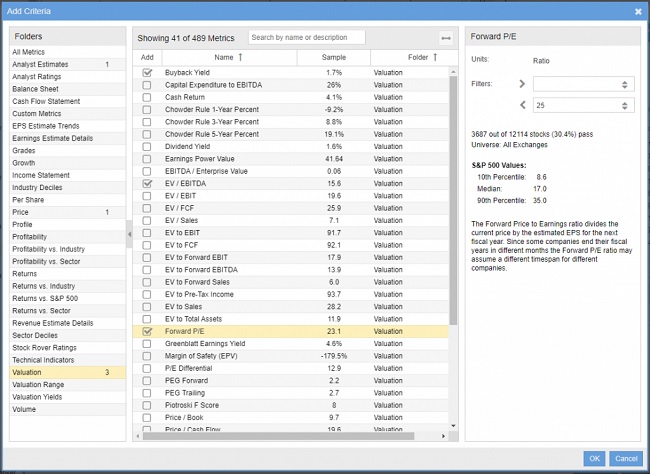
The screener tool has several default options that can target stocks based on several attributes like analyst ratings. From there, you’ll have more than 150 that you can import from the Stock Rover Library. Use them as-is, edit them, or create your own from scratch.
Examples of targetable categories include fair value, margin of safety, growth stocks, dividend growth, and more. The screener pours through a vast catalog of historical data to find opportunities that fit your criteria.
Stock Rover has also made the screening process easier to approach through its updated Screener Strategies experience.
The new “Describe a Screener. Stock Rover Builds It.” tool is designed for users who can explain the type of company they want but may not know the exact metrics required to build the screen manually.
I’ve spent a lot of time setting up Stock Rover Stock Screens since they’re so customizable, and you’ll likely want to do the same. You can even apply a second screen layer on top of the first for a truly refined search.
With the Premium Stock Rover subscription, you can also access more than 700 indicators and a wide array of other analysis tools.
Furthermore, Stock Rover’s screener uses real-time statistics and fundamental data, so you can screen stocks using the most up-to-date information.
Portfolio Management & Watchlists
After you’ve used the screener tools to locate interesting stocks, Stock Rover lets you place those picks in any number of portfolios you’d like. You’re then free to compare your portfolios to each other or benchmarks like the S&P 500 to gauge performance.
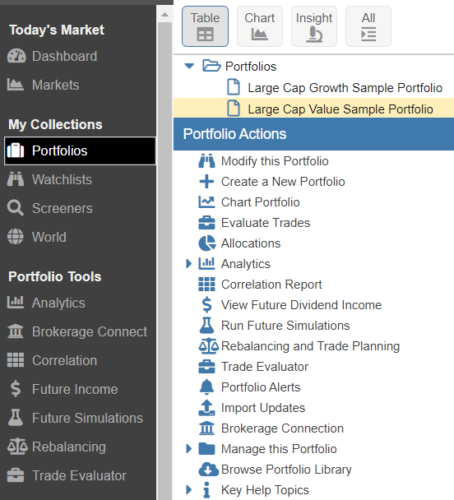
Portfolio tools don’t stop there. Alongside those analytics, it’s possible to view the correlation between individual holdings within or throw in extra tickers for additional analysis. There’s also a rebalancing and planning tool for testing potential trades.
One of my favorite features is the future income tab, where you can track potential payouts from dividends. While thinking ahead, future simulations play out potential long-term expected growth under a variety of applicable scenarios.
Stock Rover’s new Portfolio Performance Report works like an executive summary of your holdings and can analyze one portfolio or combine several accounts into a single view.
At the top, you get a quick snapshot of portfolio value, period return, income received, contributions, cash allocation, and the number of holdings.
From there, the report digs into how the portfolio performed over time and separates Money-Weighted Return, or IRR, from Time-Weighted Return.
There is even an automated Checkup feature that flags potential issues such as excessive position concentration, sector concentration, cash drag, highly correlated holdings, and high fund fees.
The warnings link back into relevant Stock Rover tools, so you can investigate the problem instead of merely being told that one exists.
Watchlists
If you have a list of stocks that you’re looking to keep an eye on, you can effortlessly create a dedicated watchlist.
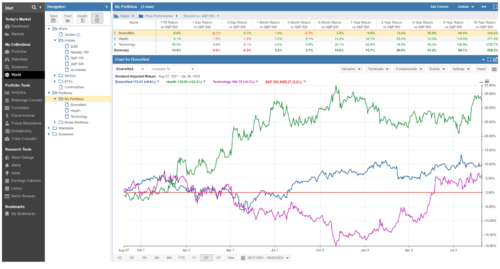
There are a few ways to set these up, but the easiest is probably creating one through the navigation panel. You can run multiple lists to track and group stock categories, such as value, dividend, momentum, or other metrics that tickle your fancy.
It’s possible to add multiple stocks at once by either separating your tickers with commas or spaces, saving tons of time in the process.
This feature also works well with charts, allowing you to view and compare your lists against stocks, industries, portfolios, indices, and other watchlists.
>> Already sold on Stock Rover? Click here to sign up today! <<
Alerts
Stock Rover issues alerts to you through text or email when an event meets your preset criteria.
For example, you receive an alert if a stock or ETF exceeds or plummets below a predetermined price point that you get in a watchlist.
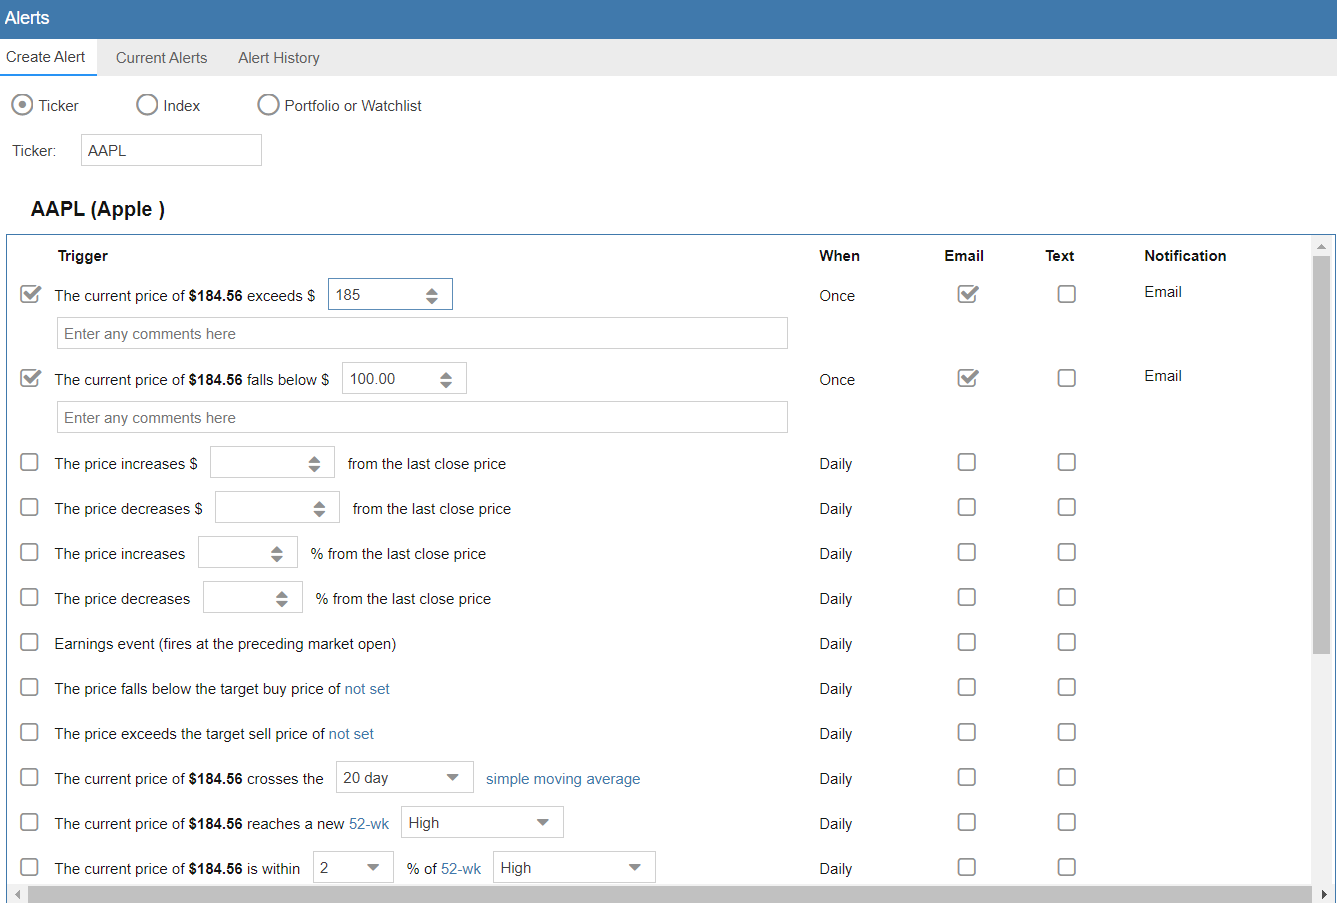
This is a handy feature for folks on the go who don’t want to spend their entire day with their eyes glued to a screen.
Some alerts you can set up are:
- Price movements passing thresholds
- Earnings surprise events
- Prices nearing 52-week highs or lows
- P/E shifts
- And more
Most screeners have some sort of alerts baked into the formula, but Stock Rovers’ options are surprisingly flexible.
That gets huge bonus points from me, and you can either set them up through your portfolio or watchlists. Heck, it’s even possible to track indices like the S&P 500.
News and Press
The News and Press feature displays the latest news on the markets and stocks in your portfolio.
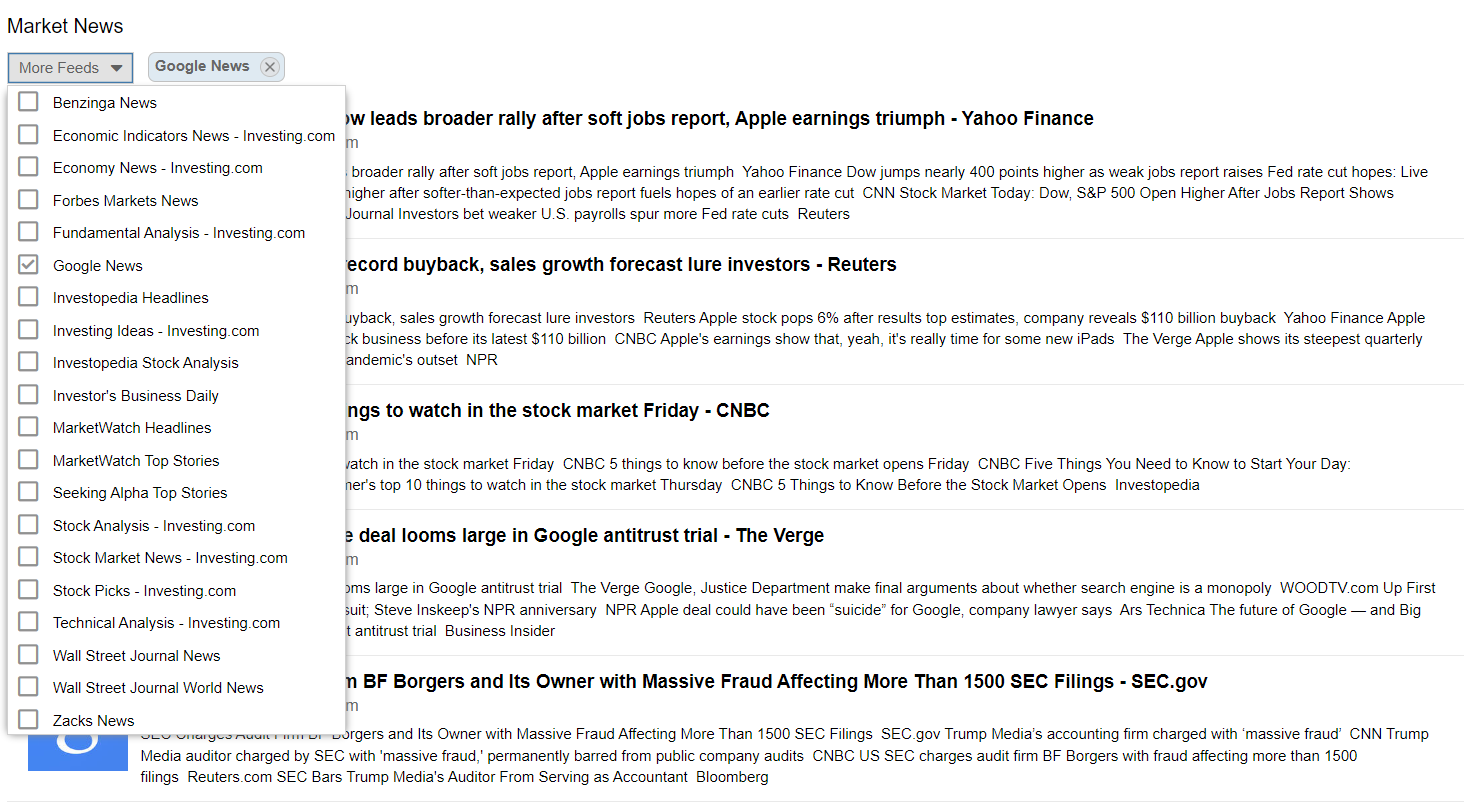
This is an excellent addition for folks looking for an all-in-one platform that doesn’t force you to split your attention between software or swap through browser tabs while trying to keep up on the latest happenings.
You can customize your feed by using the dropdown menu to add or remove news from specific sources.
Available feeds include sources such as Benzinga, Zacks, Seeking Alpha, Google, Investopedia, Forbes, and others.
Displays
Stock Rover has three panels you can use to provide different insights and visualizations of data for your stocks.
These modes are:
- Table
- Chart
- Insight
They have different indicators that you can sift through to find the exact data point you’re looking for.
As I mentioned earlier, this level of organization plays a major role in the platform’s usability. Stock research platforms aren’t exactly known for uncluttered UIs, so this is a big plus for Stock Rover.
Table Mode
Table Mode is a good option for comparing multiple stocks. This view allows users to sort search elements using a wide selection of market data, including fundamental and technical analysis indicators, and more.
You can use Table Mode to organize your stock research into a convenient spreadsheet-like display. This makes it easy to compare different stocks across multiple categories.
This particular display also allows you to incorporate data from the Stock Rover library, which includes info from balance sheets, financial statements, historical data, and more.
You can sort using analyst rankings, cash flow, dividend yields, and other statistics. For example, you can search stocks and exchange-traded funds by their returns versus the S&P 500.
This feature also allows you to create custom views to fine-tune each table to your preference.
Chart Mode
Stock Rover’s Chart Mode comes loaded with useful drawing tools, chart overlays, built-in technical analysis indicators, and much more.
This mode offers a wide array of options, including technical and fundamental analysis indicators.
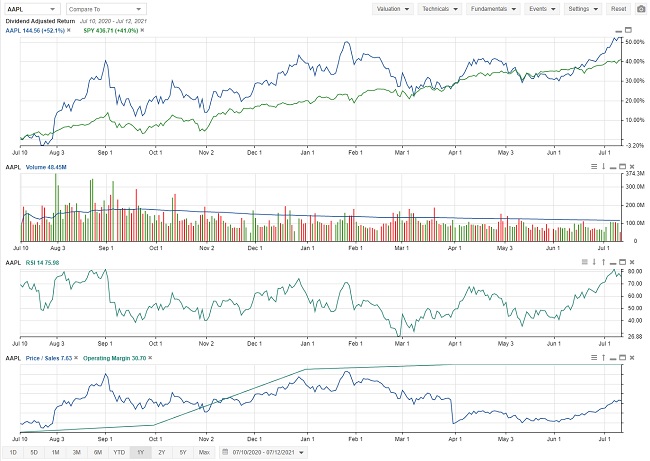
You can customize the chart display to show candlesticks, mountain graphs, line charts, and more. Available indicators include moving averages, MACD, RSI, and other popular options.
Chart mode is the best view for conducting chart-based technical analysis and analyzing price trends.
If you favor technical investing strategies, you will probably use this view often.
Charting & Analysis Tools
Charting is arguably Stock Rover’s strongest investment tool in my eyes, and probably the area I spend the most time in.
From the chart view mode, you can adjust the timeline back decades and set up as many technical indicators as you want.
With the premium subscription, you can access thousands of indicators, including moving averages, MACD, and Bollinger Bands.
Chart data updates continuously during the day. Since you can plot multiple securities on the same chart, it’s super easy to compare performance regarding various technical indicators.
There are no restrictions on plotting time against price, either: you can use any metric you’d like to plot the chart.
Stock Rover’s customizable charts are a unique and useful feature that makes conducting research much more streamlined and efficient.
>> Access Stock Rovers Advanced charting tools <<
Insight Mode
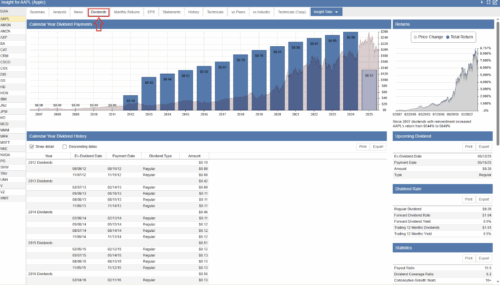
Insight Mode breaks down individual securities into an easy-to-read snapshot report for quick reference.
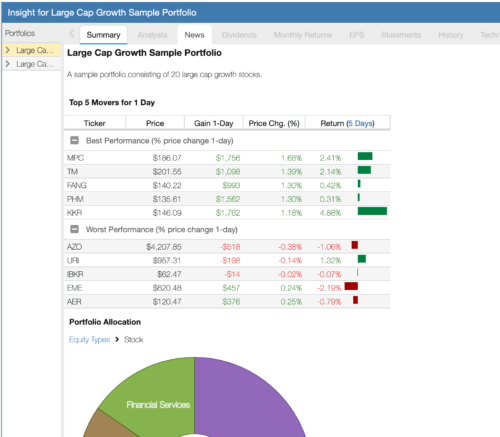
The reports produced by Stock Rover’s Insight Panel combine everything you need to know about a particular stock into one convenient one-page summary.
This view shows a lot of information at once, but don’t be intimidated.
At a glance, you’ll get info on:
- Company news
- Dividend analysis
- Financial statements
- Earnings transcripts
- Analyst ratings
- Peers and industry comparison
Also, Stock Rover clearly labels and explains each section, which makes it much easier to take in all the collected data.
Stock and ETF Comparison
This stock research tool lets you conduct side-by-side investment analysis on individual stocks using any combination of criteria and metrics you want.
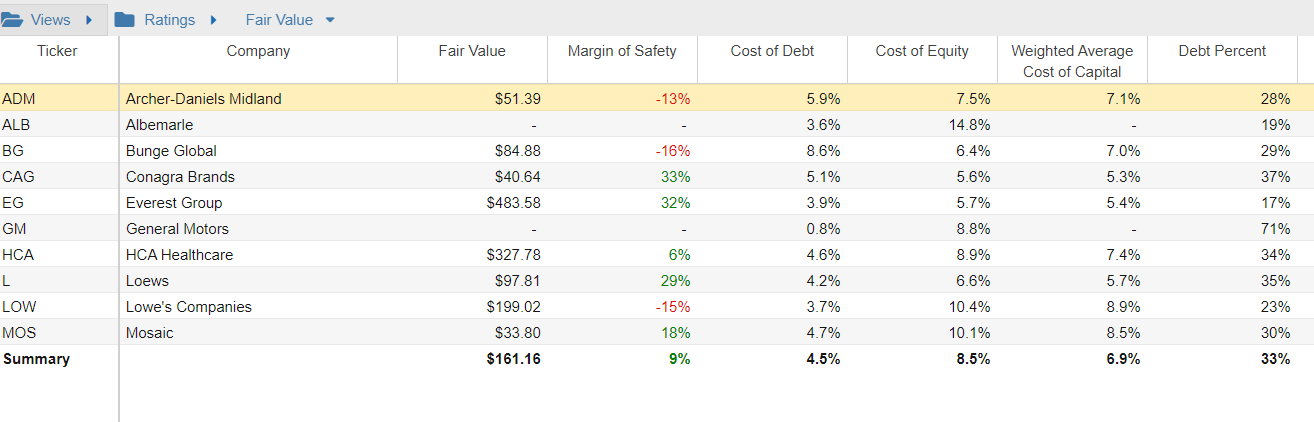
You’ll get to it through the Table view, offering an exceptionally simple UI that’s packed with rich data insights.
I love how quickly you can arrange and organize the data with just a few clicks, and Stock Rover does the rest. The stock comparison tool is set up somewhat like Microsoft Excel and can integrate with popular indices and watch lists.
The outstanding breadth and depth of these comparison tools are overwhelming at first, but once you get used to them, you’ll realize how useful and intuitive they can be.
Stock Rover Ratings
Securities also have Stock Rover ratings that provide quick insights into potential investments at a glance.
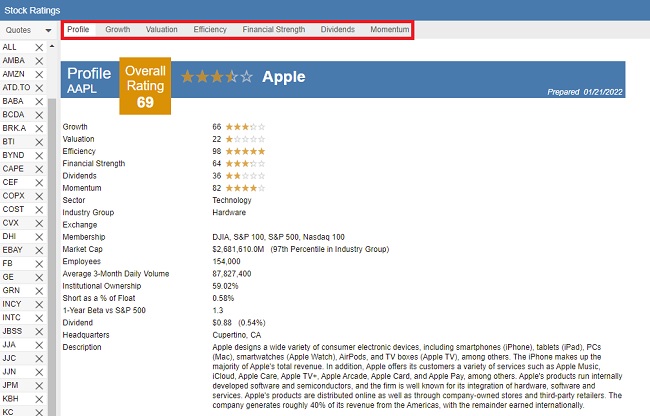
It’s an exceptional, intuitive system that aggregates a wealth of data and compares it to other stocks.
Here are some of the ratings based on stock comparison:
- Dividends Rating vs. Peers
- Efficiency Rating vs. Peers
- Financial Strength Rating vs. Peers
- Growth Rating vs. Peers
- Momentum Rating vs. Peers
- Overall Rating vs. Peers
- Valuation Rating vs. Peers
The ratings feature is fantastic.
>> Get started with Stock Rover here! <<
Research Reports & Insights
Stock Rover research reports allow users to export detailed information on stocks and ETFs that are tracked by the platform.
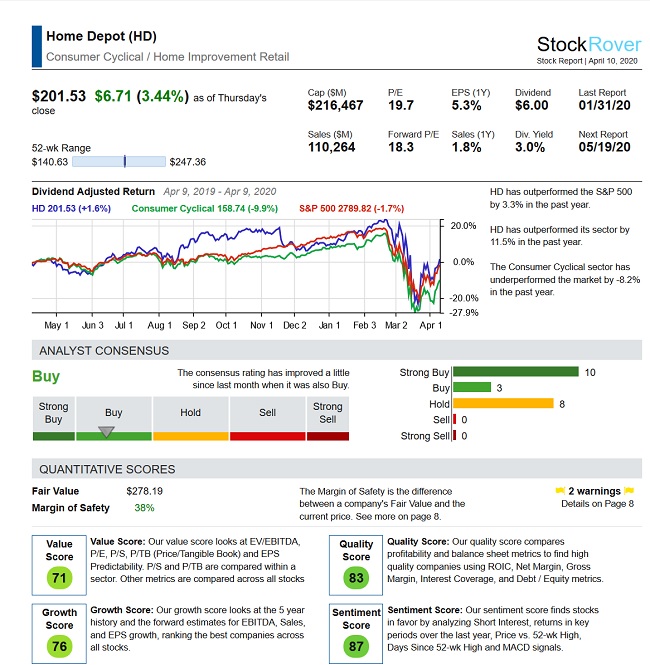
Currently, you can pull up data on more than 14,000 stocks.
These eight-page reports are jam-packed with valuable data, including:
- Overview of the stock
- Analysis
- Ratings vs peers
- Dividends
- Financial statement summary
- Valuation and profitability history
- Warnings
- Footers (report tips and disclaimers)
This is a serious stack of insights and dramatically cuts down on the hours you would typically spend collecting and organizing this data on your own.
Also, because the data follows the same pattern for each report, you can effortlessly browse the document for key data points. No more fumbling through a sea of browser tabs to find dividend history, income statements, or earnings reports.
Stock Rover’s research reports are at your fingertips and ready to read as soon as you load them up.
These security-level reports now sit alongside Stock Rover’s newer Portfolio Performance Report, which takes the opposite view by stepping back from individual companies and showing how your overall portfolio is performing.
Brokerage Integration
Stock Rover allows you to connect select brokers through Yodlee, which is a cloud-based account aggregator.
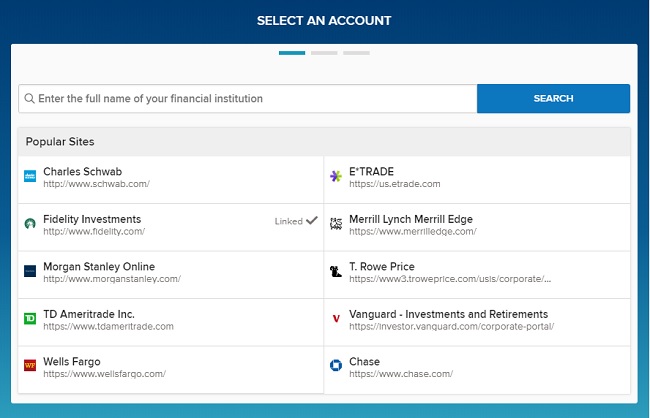
The platform is compatible with over 1,000 brokerages, and you can connect multiple portfolios to your Stock Rover account.
Yodlee syncs data from your broker directly to your Stock Rover account. This means you won’t have to hassle with manually importing your data.
Popular supported brokers through Yodlee include:
- Charles Schwab
- E*Trade
- Fidelity Investments
- Merrill Lynch
- Wells Fargo
- Vanguard
- T. Rowe Price
>> Try Out Stock Rover’s Screening Tool Now <<
Quick Start Guide
There are a lot of great features jam-packed into Stock Rover, and that can make the platform feel a bit overwhelming. Luckily, the team created a quick start guide to get you up and running as quickly as possible.
Once you open the document, you’re met with step-by-step instructions on how to make the most of Stock Rover’s more common capabilities and tips for maximizing the service’s potential.
It is 24 pages in length, but stick to the table of contents for help on whatever you’re looking for. You can always access the guide again from the website or download it to your computer as a PDF.
I’d highly recommend starting your journey here and referring back to it any time you get stuck.
Help and Support
The Quick Start Guide is an excellent place to start any time you’re feeling lost in a certain feature or want to get a little more out of the platform. For heavier questions, turn to Stock Rover’s massive help and support section.
It’s here you’ll find a laundry list of “how-to” guides that show how to do practical maneuvers within Stock Rover with ease. Helpful section titles like “Seeing What’s Hot and Finding Good Investments” help steer you where you need to go.
Further down is an entire area dedicated to product help pages. It’s organized by product features and is completely searchable.
For technical issues, turn to the support database. The Stock Rover team captures some of the most common questions in this robust FAQ.
Both the Quick Start Guide and Help and Support are parts of a much larger How To section you can access any time you want. The site’s also loaded with videos if you’re more of an auditory learner.
Portfolio Management
Beyond simple tracking, the portfolio management tool gives you a full picture of how your portfolio is structured and where risks may be hiding.
You can see correlations between holdings, identify concentration issues, project future dividend income, and use rebalancing tools when your allocations drift away from your targets.
The latest Performance upgrades make this area much easier to read by reorganizing Value Over Time into clearer groups covering portfolio value, gain breakdown, return calculations, and average exposure.
Other tools like Risk and Reward and Holdings Detail also got a makeover, allowing you to compartmentalize and customize your holdings.
The Detailed view can surface more than 26 columns, greatly increasing the depth of your portfolio management.
Monthly Returns now offers both heatmap and bar-chart views, which is useful if you want to understand how the timing of deposits or withdrawals influenced your results.
Trade Evaluator
The Trade Evaluator does just that. It lets you watch the performance of your trading actions over time. You’ll be able to see how each decision you’ve made affects your performance for better or worse.
It can be a bit painful to uncover costly mistakes, but in the end, this tool will help you learn from them.
You’re free to evaluate individual trades, trades for a specific ticker, or observe how your trades look within a portfolio. It’s even possible to compare your trades to a benchmark of your choosing.
Best of all, the entire setup is completely customizable. Play around with the settings that speak to you the most and use them to up your game.
>> Try Stock Rover Mobile App Now <<
Stock Rover’s Educational Resources
Stock Rover goes above and beyond similar platforms with its customer focus. You’re not simply handed a bunch of tools and sent on your way here; the service provides a number of additional resources for the purpose of teaching and connecting you with like-minded individuals.
Educational Materials
Once you’re on the other side of Stock Rover’s login screen, a wealth of educational resources opens up to you. Whether you’re brand new to investing or a seasoned veteran, you’ll likely find something here to help improve your game.
Available materials include articles, feature tutorials, and webinars explaining how to make the most of your time within Stock Rover. It’s possible to learn everything from gauging financial metrics to creating the custom screens that’ll become the bread and butter of your research.
>> Try Out Stock Rover’s Screening Tool Now <<
Stock Rover offers a lot of benefits, but it is not perfect. Here is my updated take after reviewing the V12 changes.Stock Rover Pros and Cons
Pros
Cons
Cancellation Policy
Stock Rover makes it easy to cancel your subscription or delete your account.
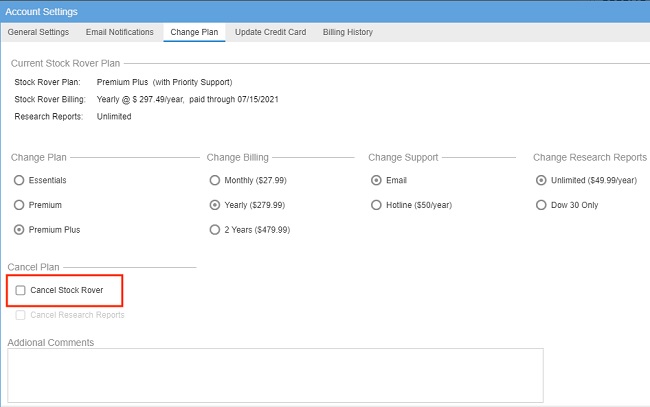
If you want to cancel, you can go to your account page and change or cancel your plan.
If you are using a paid subscription, you can still use the software until the end of your paid term.
For example, if you cancel early in a monthly billing cycle, your paid features remain active until that paid period ends.
After that, your account reverts to the free version.
It’s worth noting that legacy customers with an adjusted loyalty rate below standard public pricing get to keep that fee structure unless they cancel.
That makes cancellation worth considering carefully if you are currently paying a grandfathered rate.
Refund Policy
Stock Rover says there are no refunds for paid subscriptions.
That may sound strict, but it is not unusual for software platforms.
The service offers a trial option, which gives new users a chance to test key features before paying.
By the time you choose a paid plan, you should have a clear feel for whether the software fits your process.
Stock Rover Plans & Pricing (Free, Premium, Premium Plus, Ultimate, Ultimate Pro)
The V12 launch brought a major pricing overhaul.
The entry-level Essentials plan was retired, leaving Free, Premium, Premium Plus, Ultimate, and Ultimate Pro as the current lineup. Paid plans are available on monthly, annual, and two-year billing cycles.
Stock Rover Premium
Premium is Stock Rover’s entry-level paid tier.
Pricing is:
- Monthly: $34 per month
- Annual: $29 per month, billed at $348 per year
- Two-Year: $24 per month, billed every two years at $576
Stock Rover Premium Plus
Premium Plus is the next step up from Premium.
Pricing is:
- Monthly: $70 per month
- Annual: $49 per month, billed at $588 per year
- Two-Year: $42 per month, billed every two years at $1,008
Stock Rover Ultimate
Ultimate adds many of Stock Rover’s more advanced research and portfolio tools.
Pricing is:
- Monthly: $99 per month
- Annual: $79 per month, billed at $948 per year
- Two-Year: $69 per month, billed every two years at $1,656
This tier adds 20 years of historical fundamentals, percentile screening, higher limits, support for up to 120 screeners, 60 portfolios, and 120 watchlists. It also includes standalone Analyst Ratings and Insider Transactions research, Options Chain functionality, options pricing inside portfolios, and more advanced charting.
It’s the plan I’d recommend looking at if you want access to the major V12 upgrades without jumping to the highest tier.
Stock Rover Ultimate Pro
Ultimate Pro is the highest-end public tier.
Pricing is:
- Monthly: $199 per month
- Annual: $149 per month, billed at $1,788 per year
- Two-Year: $129 per month, billed every two years at $3,096
Ultimate Pro is built for high-volume users.
It includes up to:
- 1,000 screeners
- 300 portfolios
- 1,000 watchlists
That is a huge capacity upgrade.
Most individuals will not need this much scale.
But for serious research shops, financial content teams, advisors, or users managing many strategies, Ultimate Pro could make sense.
Existing Customer Pricing Update
Stock Rover’s legacy customer pricing change took effect for subscriptions renewing after July 22, 2026.
Those customers received a 25% adjustment from their previous renewal rate, with the resulting price referred to as a loyalty rate below standard public pricing.
Stock Rover Free Trial Details
Stock Rover offers new users a 14-day trial of its ultimate features when you open a free account. You can also switch between Stock Rover plans during your trial and determine which one best suites your needs.
That gives you enough time to test the screeners, charts, portfolio tools, and other core features before committing to a paid plan.
I would make use of the trial, especially now that the platform has become more complex.
Two weeks should be enough to build several screens, create or connect a portfolio, try the new Dashboard, and see whether the research workflow suits you.
Stock Rover Coupon Code
After signing up for the free trial and using the app, you’ll currently receive a code about a week in for 25% off a yearly subscription.
The code comes right to you so long as you’re active during the trial, which is a nice touch.
Stock Rover Discount
Stock Rover does offer discounts if you sign up for a one- or two-year subscription. If you’re still on the fence, I’d use the 14-day trial first and move to a longer billing cycle only after you know the platform fits your research process.
>> Sign Up for Stock Rover’s Free Premium Plus Trial Now <<
Stock Rover Reviews by Members
If you check out independent reviewers, the general consensus seems to be that Stock Rover is a standout screener packed with valuable tools.
However, we couldn’t find any reviews on third-party sites.
The Stock Rover site hosts plenty of positive reviews of the service, though.
Here’s what others have to say about Stock Rover:
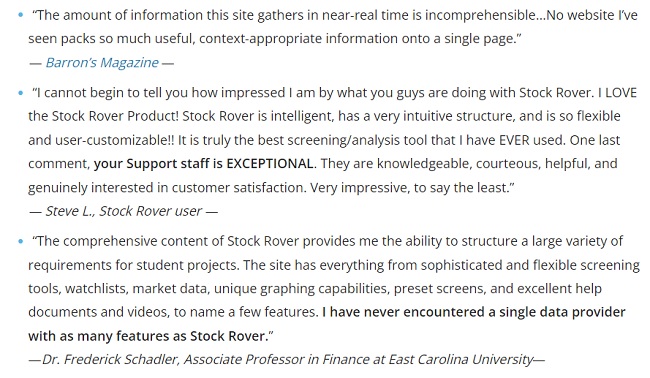
Because these are directly from the Stock Rover site, you might want to take them with a grain of salt.
>> Try Stock Rover now for free <<
Stock Rover Performance
Stock Rover has more screeners than you can shake a stick at, and there’s simply no way to try them all. That said, I did play around with the platform’s Beat the Market screener, and I was pleasantly surprised with what I saw.
Going back five years, this one screener blows gains made from the S&P 500 over the same interval out of the water. It’s equally weighted and is even benchmarked against the S&P.
While the S&P did see a 100% increase over that threshold, Beat the Market had more than double the success. There’s a good chance other screeners within Stock Rover performed even better. After all, there are more than 150 to choose from.
Platform Differentiators
Stock Rover stands apart from other stock screeners in several ways.
Comprehensive Custom Screeners
The screener is the core strength.
With hundreds of metrics, dozens of preset screeners, and new V12 additions, the platform lets you build very specific searches.
You can screen for valuation, quality, growth, dividends, analyst ratings, risk, and much more. Pre-built strategies like the Dividend Income Machine and Insider Activity Surge give you a running start.
The newer Screener Strategies experience improves accessibility as well.
Being able to describe the type of screen you want and let Stock Rover help build it should make advanced screening less intimidating for users who do not know every metric by name.
Customization and Visualization
A stock screener is only useful if the data is easy to read.
Stock Rover does well here.
You can use charts, tables, reports, ratings, and visual tools to understand what the data means.
V12 improves this with better charting, custom colors, chart drawing tools, and analyst rating overlays.
The redesigned Dashboard strengthens this point further.
Rather than simply displaying more widgets, Stock Rover now lets you consolidate holdings information and customize which panels remain visible.
Portfolio Depth
The portfolio tools here are stronger than what many stock screeners offer.
You can track holdings, compare performance, study risk, review allocation, project dividend income, rebalance portfolios, and evaluate past decisions.
The new Portfolio Performance Report pushes this advantage even further by bringing wealth creation, contributors and detractors, risk metrics, income projections, and automated portfolio checks into a single report.
That turns Stock Rover into a comprehensive research and portfolio-analysis hub rather than just a stock filter.
Easy Integrations
Brokerage integration helps reduce manual work.
When your holdings are connected, you can analyze your full financial picture in one place.
That helps limit errors and makes rebalancing easier.
Professional Scale
The new Ultimate and Ultimate Pro tiers give Stock Rover more room to serve advanced users.
With higher limits, 20 years of historical fundamentals, percentile screening, options support, and detachable research windows, the platform now feels more capable for serious research workflows.
Is This Service Right for Me?
Stock Rover is not the best fit for every market user. It works best for people who enjoy data, research, and structured decision-making.
Long-Term Fundamental Researchers
This is where Stock Rover shines.
If you want to understand what you own and why, the platform gives you deep financial metrics, historical data, valuation tools, and peer comparisons.
Dividend-Focused Users
The Future Income tab and dividend analysis tools are great for anyone building an income-focused portfolio.
You can project payouts, screen for dividend growth, and study dividend safety. The Dividend Income Machine screener is a good starting point.
The new Performance Report feature also projects expected income over the next 12 months, making the platform more useful for anyone who wants to see how current holdings may translate into future cash flow.
Active Portfolio Managers
If you manage several portfolios or accounts, Stock Rover can act as a command center.
You can track holdings, review correlations, rebalance with more discipline, and now combine multiple portfolios inside the Performance Report to analyze aggregate returns, allocation, risk, and projected income.
The higher limits in Ultimate and Ultimate Pro make this even more useful for complex setups.
Chart Users
Stock Rover is not a pure technical charting platform, but it has strong chart tools. V12 improves this with custom trendlines, custom chart colors, and analyst rating overlays.
Options Users
This is a new area of strength. Ultimate and Ultimate Pro users now get an integrated Options Chain, contract charting, expiration-based research, options trade management, and options pricing inside portfolios.
That said, users on lower tiers may still need another platform.
Stock Rover vs Other Stock Screeners
Here are a couple of other stock screeners that I’ve been able to review in case Stock Rover doesn’t match your style:
Stock Rover vs. TradingView
TradingView is strongest when the goal is to see what the market is doing right now. It’s highly visual, fast-moving, and popular with traders who like spotting trends, momentum, and price patterns as they form.
The social aspect also plays a role, with investors sharing ideas and watching the same setups unfold in real time.
Compared to that, Stock Rover feels more deliberate. Instead of tracking short-term moves, it shines when evaluating companies over time and understanding how holdings fit together.
The difference largely comes down to pace: TradingView is about immediacy, while Stock Rover is built for patience and long-term decision-making.
Stock Rover vs. Benzinga Pro
Benzinga Pro excels at speed. It’s designed to surface breaking news, unusual activity, and market-moving headlines as they happen.
If you’re really active in the markets, that immediacy can be valuable, especially when timing matters and reacting quickly can make a difference.
That contrasts with Stock Rover’s strengths. Rather than pushing constant alerts, it supports deeper research and steady portfolio oversight.
Benzinga Pro helps explain what just happened in the market, while Stock Rover is better suited for deciding what to own and why over the long run.
Is Stock Rover Worth It in 2026?
Yes, I think Stock Rover is worth it in 2026, especially for people who want a serious research platform rather than a simple stock-picking app.
The platform already had strong screeners, ratings, reports, portfolio tools, and charting features.
V12 made the case stronger with Analyst Ratings, Insider Transactions, Crypto summaries, Ultimate and Ultimate Pro, 20 years of historical fundamentals, percentile screening, options support, and deeper charting.
I really like that they didn’t stop there, showing me that the team behind Stock Rover is passionate about making it the best it can be.
The new Dashboard makes the platform easier to navigate, while the Portfolio Performance Report gives you a much clearer answer to a question that matters just as much as finding a good stock: “How is my overall strategy actually doing?”
The biggest drawback is price, but for people who use Stock Rover as a true research hub, the higher price can still make sense.
You could replace several separate tools with one subscription. That saves time, reduces clutter, and helps keep your process more organized.
I would not recommend Ultimate Pro to most casual users. It is probably overkill.
Premium, Premium Plus, or Ultimate will make more sense for most people, depending on how much data and options support they need.
The best move is to start with a trial, test your workflow, and see which tier fits.
>> Click Here to Claim Your Free 14-Day Stock Rover Trial Now <<
FAQ: Stock Rover Common Questions
What is Stock Rover used for?
Stock Rover is an investment research and stock screening platform used to analyze stocks, ETFs, and portfolios. It helps investors evaluate financial metrics, compare companies, and identify potential investment opportunities based on customizable criteria.
Is Stock Rover suitable for beginners?
Stock Rover can be used by beginners, but it has a learning curve. While the interface offers guided tools and presets, new investors may need time to understand advanced metrics, filters, and valuation models. The free plan is available for anyone who wants to explore the platform before committing to a paid tier.
Does Stock Rover offer a free version?
Yes. Stock Rover offers a free plan that provides limited portfolio tracking, and access to standard financial data. More advanced features require a paid subscription.
What changed with Stock Rover V12?
V12 introduced a redesigned website, expanded Dashboard tools, Analyst Ratings, Insider Transactions, Crypto summaries, Ultimate and Ultimate Pro plans, options support, advanced charting, 104 new metrics, nearly 80 new screeners, and higher data limits.
Stock Rover has since added a new Portfolio Performance Report, upgraded its underlying portfolio performance tools, and released another redesigned Dashboard focused on cleaner organization and more efficient widgets.
What are the differences between Stock Rover plans?
Stock Rover offers multiple tiers, including Free, Premium, Premium Plus, Ultimate, and Ultimate Pro. Higher-tier plans unlock advanced screening tools, deeper historical data, portfolio analytics, and more detailed financial metrics.
Does Stock Rover cover crypto?
V12 adds Crypto summaries to the dashboard. This gives users a broader market view, though Stock Rover remains strongest as a stock and ETF research platform.
Is Stock Rover better than other stock screeners?
Stock Rover stands out for its depth of financial data and portfolio analysis tools. However, it may not be ideal for traders who prioritize real-time charting or technical indicators, where other platforms may perform better.
Does Stock Rover provide real-time stock data?
Price quotes are real-time for most stocks. Data for obscure stocks is delayed about five minutes, while Canadian and micro-cap stock info is about 15 minutes behind.
Can Stock Rover track investment portfolios?
Yes. Stock Rover includes portfolio tracking features that allow users to analyze holdings, performance, diversification, and risk metrics across multiple portfolios.
Does Stock Rover include stock ratings or recommendations?
Stock Rover does not issue direct “buy” or “sell” recommendations, but it provides comprehensive proprietary stock ratings and scores. This includes 1–100 percentile scores for Growth, Value, Quality, Sentiment, and Overall performance relative to industry peers, as well as health metrics like the Altman Z-Score and Piotroski F-Score. Stock Rover also integrates Wall Street analyst consensus ratings, price targets, and estimate revisions to help you form your own data-driven decisions.
Is Stock Rover worth paying for?
Stock Rover may be worth the cost for long-term investors who value deep financial analysis and screening flexibility. Investors seeking simpler tools or short-term trading signals may find less value in paid plans.
How often is Stock Rover data updated?
Financial statements and company data are updated regularly as new information becomes available. Update frequency depends on earnings releases and data provider schedules rather than real-time market movements.
Does Stock Rover support international stocks?
Stock Rover primarily focuses on U.S. stocks and ETFs, but also includes comprehensive coverage of Canadian exchanges like the Toronto Stock Exchange and TSX Venture.
Are there Stock Rover alternatives investors should consider?
Yes. Popular alternatives include platforms that focus on technical analysis, real-time charting, or simplified screening. The best alternative depends on whether an investor prioritizes fundamentals, technicals, or ease of use.
Does Stock Rover offer a free trial for paid plans?
Yes. New users receive a 14-day free trial to explore top-tier ultimate features; no credit card required. During the trial period, you can freely switch between the different subscription tiers at any time to compare tools and determine which plan best fits your specific research workflow.



 Tags:
Tags: