
As an investor, there are only two ways to enter a trade: on a pullback or a breakout.
But what is a stock pullback, and how can you identify it? How is it different from a retracement or a reversal? We look at all this and more in the article below.
What Is a Stock Pullback?
A stock market pullback is a temporary and short-duration decline in the price of a financial asset during an upward momentum. It is similar to consolidation or retracement. These terms are often used interchangeably, but each has its own connotation.
Consolidation is a longer-drawn process. On the other hand, retracements are for shorter periods than pullbacks.

We will look at the differences between these three as we go along. But first, let’s understand how a pullback is beneficial for traders.
Why Is a Pullback Good?
Pullbacks are excellent points of entry into a security that has solid technical indicators and whose price movement is upwards.
They can use the slight fall in price to quickly create a position and then enjoy the continued prevailing trend once the pullback ends.
Of course, it is always possible that what one sees as a pullback is a reversal.
For this reason, stop entry and limit orders are often employed to reduce the risk in a pullback trading strategy.
What Is a 10% Pullback?
Pullbacks are generally in the 5-10% drop range. Hence a 10% pullback is a correction.
With this big drop, the likelihood of a further decrease and subsequent decline, and even a reversal becomes higher.
Normally, pullbacks are mild and are not seen as a reason for a sell-off. But if the market sees a 10% pullback, it might start a declining trend.
How Do You Identify a Pullback?
To identify pullbacks, the first step is to ensure that the market is trending (either upward or downward).
Once this is established, the next step is establishing the trend’s strength.
One easy way to do this is to identify which moving averages the trend respects in your frame of reference.
For example, if a 20-day moving average supports the trend, it is likely a strong trend.

If, instead, the 200-day moving average is the support, the likelihood of the trend being weaker is higher.
The next step is to identify the entry point into the pullback. One simple way is to accept the supporting moving average as an entry point.
Finally, the exit point depends on whether the strategy was right or wrong.
For example, if the market works in your favor, it might be simple to just hold on to the share if the overall trend is positive.
But a stop loss (like the last support turned resistance) might be better if the market moves against your position.
How Do You Tell the Difference Between a Pullback and a Reversal?
Pullbacks are temporary declines, but reversals are long-term falls.
Moreover, a reversal usually indicates a larger issue, whereas fleeting shocks cause pullbacks.
When a pullback happens, traders soon figure out that the cause is transitory; hence, recovery begins in just a few sessions.
But if a fundamental change is causing the drop, a pullback might turn into a reversal.
Let’s take an example.
An expected major product release might create a positive rally in a particular firm’s stock price.
But during the release, if customers find the offering to be of a poor standard, there would be a pullback.
If the firm reacts quickly and makes the necessary adjustments, there can be a recovery.
But if the company shows laxity, the fall can precipitate from just a pullback into a longer-term reversal as profitability starts to decline.
What Is the Difference Between Pullback and Retracement?
A retracement is a minor form of a pullback. Both terms are often used interchangeably; their difference is hard to pinpoint.
Typically, retracements do not say anything about the larger market environment.
On the other hand, pullbacks indicate a temporary loss of confidence in a security.
It might also be because of a small period when short-term traders are indulging in profit-taking, so the price falls slightly.
Lastly, a retracement can refer to an upswing during a downward trend and vice versa.
Pullback usually refers to a decline in an otherwise increasing trend.
The corresponding term for an upward movement when prices are falling is known as a breakout. We will cover them later.
How Often Do Pullbacks Happen?
A 10% or higher correction has happened once every 19 months in the S&P 500, considering data from 1928 onwards.
For a 5% pullback, this figure is closer to 13 months.
Given that a pullback is usually a 5% to 10% decline, the frequency of one will lie somewhere between these two time periods.
This is based on past data and may or may not be true for the future.
How Long Does a Pullback Last?
Pullbacks are short-duration events; they last up to a month. It might take the market another month to climb back to its original valuation.
For example, a positive earnings announcement for a company might cause a bull run on its stock.
After a few sessions, traders want to exit positions and book profits. This might lead to a pullback.
On the other hand, a market correction may take as long as six months to bottom out and a similar time to recover the previous highs.
These are deeper falls in value, to 10-20%.
The higher drop indicates more volatility, which shows traders are worried about some fundamental problems in the share.
Which Is Better, Pullback or Breakout?
A breakout is the opposite of a pullback.
It is termed a breakout when the asset sets a high or low price but later pushes through and moves to a different high or low.
A breakout strategy focuses on selling when the market is declining and buying when it goes up. Hence its direction coincides with that of the market.
Pullback trading is the opposite of this. It involves trading against the flow of the market.
Both are good ways to decide entry points in a trending market.
A pullback can be slightly conservative because it waits for an adverse price action. Breakouts are aggressive because they work in the direction of the market.
In both cases, the risks are nearly equal, and there is no clear way to decide which option is better.
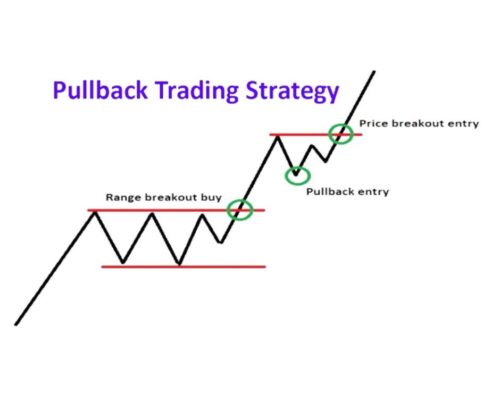
What Is a Pullback Strategy?
A pullback strategy involves identifying a price point at which the stock takes a temporary dip before an uptrend resumes and enters at that time.
This can be achieved in several ways:
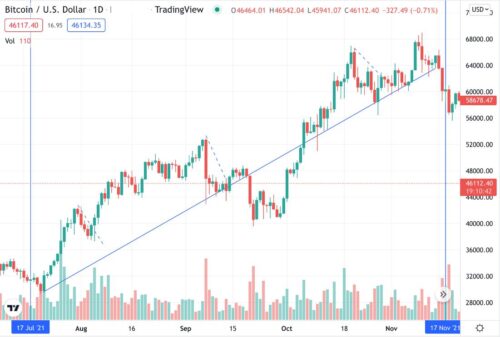
Trendline
This involves identifying a series of higher highs and higher lows in a chart. One of the easiest ways to do it is a trend high and low structure.
Of course, trendlines take longer to spot. They need at least three occurrences to verify, making them less useful for short-term traders.
Moving Averages
These can be used for identifying pullbacks, as we explained earlier. Generally, 20, 50, and 200-point moving averages are used for identifying support and resistance levels.
These can further be used to spot pullbacks and breakouts.
Shorter-term traders use smaller moving point averages, but the shorter they get, the higher the risk of noise and false signals.
Fibonacci Retracement
This is another method for identifying support and resistance levels, using Fibonacci numbers as a base.
The most common points used in this method are 23.6%, 38.2%, 61.8%, and 78.6% of the last high or low.
Are We in a Bear Market in 2026?
Yes, we are currently in a bear market It hit us on 13th Jun’22, when the S&P 500 fell below 20% from previous highs on 3rd Jan’22.
There are many possible reasons why this has happened.
The key ones might be the situation created by the Covid-19 pandemic, a shift in the fed’s interest rate policy, and the energy crisis due to the ongoing war in Ukraine.
It is possible that going into 2023, we might continue to see similar volatility in the market.
However, this is all merely speculation.
Market movements depend greatly on how the macroeconomic scenario pans out and several other parameters.
Is Pullback Trading Profitable?
Yes, pullback trading can be profitable as long as the investor is willing to understand and appreciate the risks involved.
Utilizing these methods is difficult because traders have to take buy and sell positions against the market’s direction.
After all, trying to buy when the market is dipping and sell when prices are going upward seems counterintuitive.
However, trading pullbacks can work well as long the larger trend is assured due to the fundamentals of the underlying financial asset.
The main risk of following this method is misjudging the start of a reversal for a pullback.
To minimize losses in case this happens, it is important to use stop losses in your orders.
Final Thoughts
Pullback trading utilizes the natural rhythms of the market to identify entry points during an upward trend.
There are many ways to identify pullbacks, such as trend lines, moving averages, and Fibonacci retracements.
All such strategies try to buy when the price movement is against the overall trend and sell when it is the other way around.
Pullbacks are longer than retracements but are shorter and less volatile than reversals.
They usually do not reflect a fundamental change in the asset’s strength but are created out of temporary market shocks.
Apart from pullback trading, another common strategy is breakouts.
These involve buying an asset when it has just moved out of a pullback area and is continuing with its usual trend.
Both strategies are effective, but some might call pullbacks more conservative than breakouts.
 Tags:
Tags: