If you’ve ever turned on a finance show or opened an investing app, you’ve probably seen short strings of letters next to flashing numbers. Maybe you’ve wondered what all that means or why those numbers change every second. You’re not alone. For many new investors, the language of stock tickers and quotes feels confusing at first. Fortunately, once you understand how to read them, everything starts to make sense.
Knowing how to read stock tickers and how to read stock quotes is like learning to read a new alphabet for the financial world. These symbols and numbers tell the story of how companies are performing and how investors feel about their future. Once you can interpret them, you’ll be able to follow the market confidently instead of guessing what’s going on.
Understanding What a Stock Ticker Really Means
Let’s start with the basics. A stock ticker is a short code that represents a company’s stock on an exchange. It’s how investors and brokers identify and trade shares without confusion. Think of it as a stock’s nickname in the marketplace.
Apple’s ticker is AAPL. Tesla’s is TSLA. Coca-Cola’s is simply KO. These are called stock ticker symbols, and each one is unique. If you see those letters on a financial news screen or your trading app, you’re seeing what stock tickers mean in action.
Every exchange has its own naming rules. The New York Stock Exchange, or NYSE, usually uses one to three letters, while Nasdaq often uses four or five. That’s why you’ll find Ford trading as F on the NYSE and Amazon trading as AMZN on Nasdaq.
Sometimes, you’ll see symbols like BRK.A and BRK.B for Berkshire Hathaway. Those extra letters show different classes of shares, which have different prices or voting rights. If you ever forget a ticker, don’t worry. You can always do a quick stock symbol lookup on Yahoo Finance or Google Finance to find it.
Understanding stock tickers is the first step toward feeling at home in the market. Each symbol carries meaning, history, and a link to a company’s story.
 What a Stock Quote Tells You
 What a Stock Quote Tells You
Once you know a ticker, the next thing you’ll see is the stock quote. This is where the numbers come in. A stock quote shows the latest trading information for that company’s shares. It’s like a snapshot of the market’s opinion at that exact moment.
Here’s what a typical quote might look like:
AAPL | 189.42 | +2.13 | +1.14% | 56.3M | 3:45 PM ET
It may look like a jumble of data, but every part tells you something useful. Let’s walk through what each part of a stock quote means so it all starts to click.
The first part is the symbol, like AAPL, which identifies the company. Next comes the last price, which shows the most recent trade. If you bought Apple stock at that moment, you’d pay around $189.42 per share.
Then come the change and percent change, which show how much the price has moved since yesterday’s close. A plus sign means the stock rose; a minus sign means it fell. This helps you see if investors feel optimistic or cautious today.
After that, you’ll notice the volume, which tells you how many shares traded so far. High volume often means strong interest or news affecting the company. Finally, the time shows when the last trade happened, since prices move throughout the day.
Reading stock quotes for beginners is really about getting comfortable with these bits of information. Once you know what each piece means, you’ll start seeing patterns everywhere.
Breaking Down the Key Parts of a Quote
If you dig a little deeper into a quote, you’ll see more details. These extra pieces help you understand the market’s mood and the stock’s value.
One of the most important is the bid and ask prices. The bid shows the highest price a buyer is willing to pay, while the ask shows the lowest price a seller will accept. The small gap between them is called the spread. This difference might look tiny, but it shows how liquid or active a stock is. Learning how to read the bid/ask spread on quotes helps you see how easily shares can change hands.
Then there’s the day’s range, which lists the lowest and highest prices during the current session. The day’s range gives a sense of how volatile the stock has been today. If you want a bigger picture, look at the 52-week range, which shows how much the price has moved over the past year.
You’ll also find the market cap (capitalization), which tells you the company’s overall value. It’s calculated by multiplying the share price by the number of shares in circulation. A large-cap company, like Apple or Microsoft, is worth over $10 billion. Mid-cap companies fall between $2 and $10 billion, and small-cap companies are below $2 billion.
Each of these details — from bid vs ask price to market cap — helps you see how investors view a company and where it stands in the market.
The Difference Between a Stock Ticker and a Stock Quote
It’s easy to mix up the two, but the difference between a stock ticker and a stock quote is simple. The ticker is the name; the quote is the story.
A ticker tells you which company you’re looking at. A quote tells you what’s happening to that company’s stock right now. The ticker is the label; the quote is the heartbeat. You need both to understand the market clearly.
How to Read a Stock Data Step by Step
Once you’ve got the basics, you can start reading stock data like a pro. Here’s how it works in practice.
Say you want to read the data step by step for Tesla. You start by finding its ticker — TSLA — on your trading platform. You’ll see that it trades on Nasdaq, meaning it follows that exchange’s listing rules. You’ll notice its quote showing the last price, percentage change, and volume.
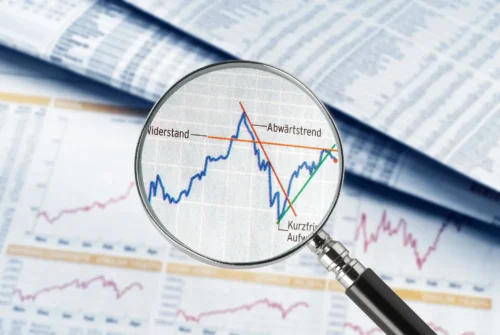
Then, to go deeper, you can open its chart. Looking at a stock price chart gives you the bigger picture — where the stock’s been and where it might be heading. You’ll soon see how stock price quote breakdown data connects with the chart. When price rises on strong volume, it signals strong demand. When price falls sharply with little volume, it may just be a temporary dip.
Learning how to read stock market data for beginners is about noticing these small patterns. It’s not about guessing the future but understanding what’s happening right now.
Reading Quotes During Extended Hours
The stock market officially runs from 9:30 AM to 4 PM Eastern Time, but trading doesn’t stop there. Investors can buy and sell during pre-market (before 9:30) and after-hours (after 4 PM) sessions.
Knowing how to read extended hours stock quotes is helpful, because prices can move sharply during these quieter periods. For instance, if a company reports earnings after the bell, its stock might jump or drop long before regular trading resumes.
These movements can be exciting but also risky. Fewer people trade at these times, so prices can swing quickly. If you check after-hours data on sites like Yahoo Finance, you’ll see smaller volumes and wider spreads. That’s normal. Just remember that after-hours quotes are a preview of how the market might react when it opens again.
Why Understanding Stock Tickers and Quotes Matters
Sadly, many new investors skip this step and jump straight into buying stocks. But understanding stock ticker explained and stock quote explained concepts first gives you a strong foundation.
When you can interpret a ticker and quote, you’re not just watching numbers move. You’re reading a story about supply and demand, emotion, and belief. Every uptick and downtick reflects how investors feel about a company’s future.
Fortunately, this knowledge turns fear into clarity. Once you know how to interpret stock quotes, you can make choices based on information, not emotion. You’ll understand why some stocks rise while others fall, and you’ll start to see the bigger picture that drives markets day to day.
Examples That Make It Real
Let’s look at a few examples of stock ticker symbols explained. Apple trades as AAPL, representing its name. Tesla uses TSLA, a nod to its founder’s inspiration, inventor Nikola Tesla. Coca-Cola goes by KO, which traces back to the drink’s early nickname “Koke.” These symbols have history, but they also show how recognizable brands turn into easy-to-track tickers.
Once you begin to recognize them, following the market becomes second nature. Soon, you’ll glance at tickers like MSFT or AMZN and instantly know who they belong to.
 Frequently Asked Questions
 Frequently Asked Questions
What do stock ticker symbols mean?
They are short names that represent a company’s shares on an exchange. For example, AAPL means Apple, and TSLA means Tesla.
How do I interpret a stock quote?
Look at the last price, the daily change, and the trading volume. These show you where the stock is and how active it’s been.
What are bid and ask prices?
The bid is what buyers offer; the ask is what sellers want. The small gap between them is the spread, which tells you how easily a stock trades.
Are stock quotes always live?
Not always. Many free sites show prices with a 15-minute delay. Brokerage platforms often give real-time data.
Where can I learn more about reading quotes?
Sites like Yahoo Finance, Google Finance, and your broker’s app are great places to practice. Each shows stock quote components clearly, making learning easy.
Conclusion
Learning how to read stock tickers and quotes is like unlocking a new language. Once confusing letters and numbers start to form a clear picture. You begin to understand what drives the market — and more importantly, how to make thoughtful investing choices.
By taking time to understand what each part of a stock quote means, learning how to interpret stock quotes, and practicing with real examples, you’ll soon feel comfortable navigating the financial world.
Markets can seem fast and unpredictable, but knowledge slows things down. The more you learn, the calmer you’ll feel. Every investor starts somewhere, and now you know exactly how to begin — one ticker, one quote, one confident decision at a time.
 Tags:
Tags: