There’s a bit of buzz around Marc Chaikin’s Power Gauge, and I wanted to see if it’s worth the hype. Read along as I offer a deep dive into this powerful software and its namesake newsletter, Power Gauge Report.
What Is the Power Gauge?
The Power Gauge is a powerful software developed by Marc Chaikin and the team at Chaikin Analytics.
It analyzes 4,000 stocks (and ETFs) based on 20 indicators that include Marc Chaikin’s proprietary indicators.
Once the software analyzes the stock, it provides users with a favorability rating.
Something to keep in mind is that the software does not provide trade recommendations. Rather, it offers insights that members can use to locate stocks with solid profit potential.
Even if the software offers a high Power Gauge Rating, this does not guarantee that the stock will increase in value down the road.
It’s a tool intended to provide an extra layer of analysis.
>> Already sold? Get Power Gauge Ratings TODAY! <<
Is the Power Gauge Accurate?
The Power Gauge does a great job of assessing a stock’s potential.
There is no such thing as a crystal ball in investing, so bullish signals do not guarantee that a stock or ETF will appreciate in value.
That said, the software uses legit indicators that could locate solid opportunities.
How Does the Power Gauge Work?
The Power Gauge runs straight through your browser. Once you sign up and sign in, you can jump into the thick of things: you do not need to download any software.
There are a few reasons why I prefer the browser option over the downloading software.
With the Power Gauge Ratings, the computing is done on the other end, so even an unoptimized PC or Mac could have a better chance of running it.
Another reason I prefer the browser feature is that I’m not keen on installing software on multiple devices (unless I really have to). It’s a chore.
What Does the Power Gauge Do?
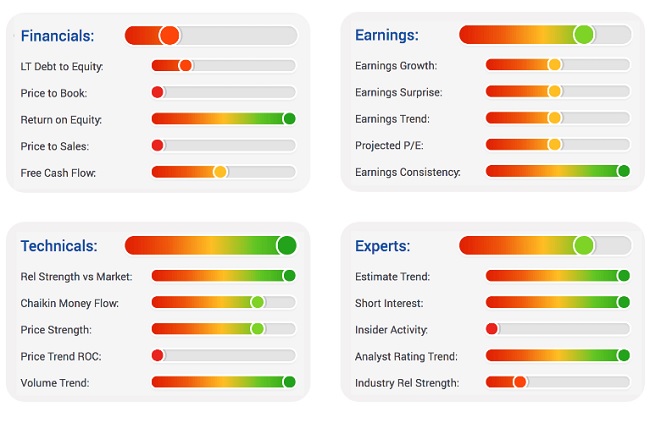
The Power Gauge provides an easy-to-understand rating based on 20 key indicators. These indicators are broken up into four distinct categories: Financials, Earnings, Technicals, and Experts.
In addition to the aggregate rating, there are ratings for each category.
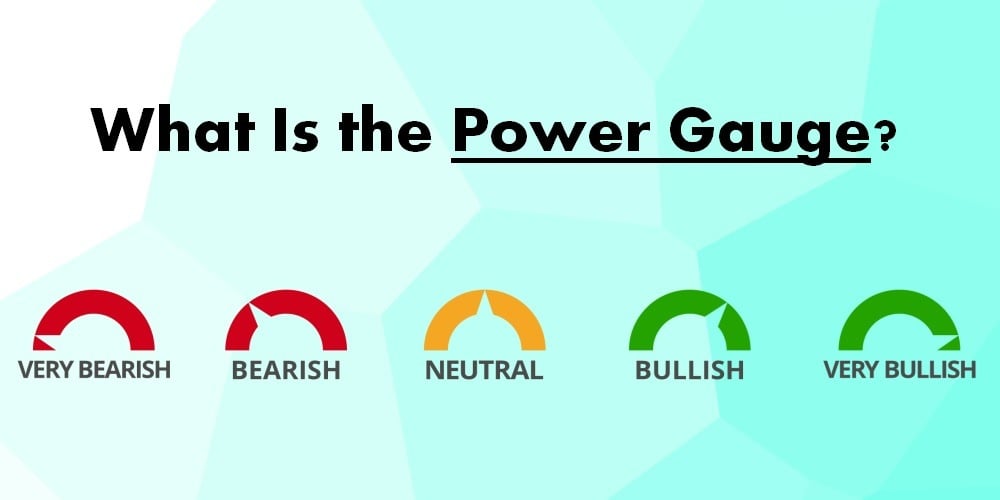
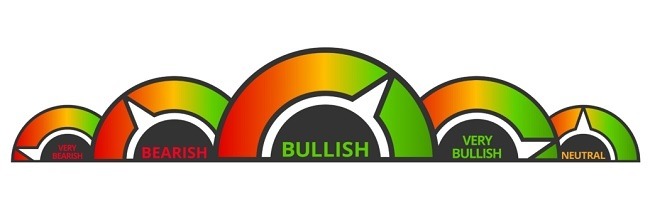
The software rates every stock as Very Bullish, Bullish, Very Bearish, Bearish, or Neutral.
To use the software, simply type in a company or ticker into the search bar, and you will be presented with the latest Chaikin Power Gauge Rating.
I’m going to look one up in real time to give an idea of how it works. I’ll need to blur out the details, however, as this info is for members only.
The ratings from my example were pulled from the Power Pulse software, which is available through Power Gauge Report subscriptions.
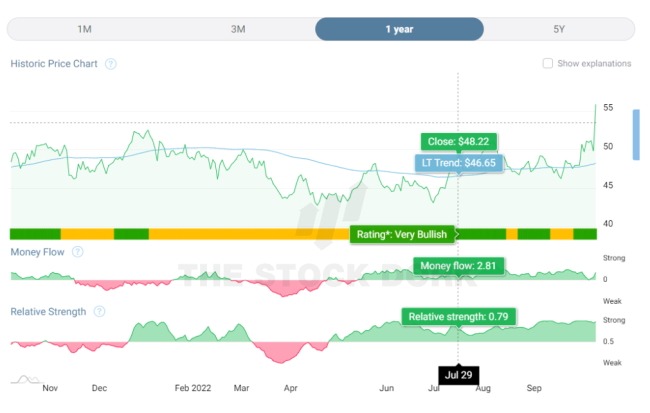
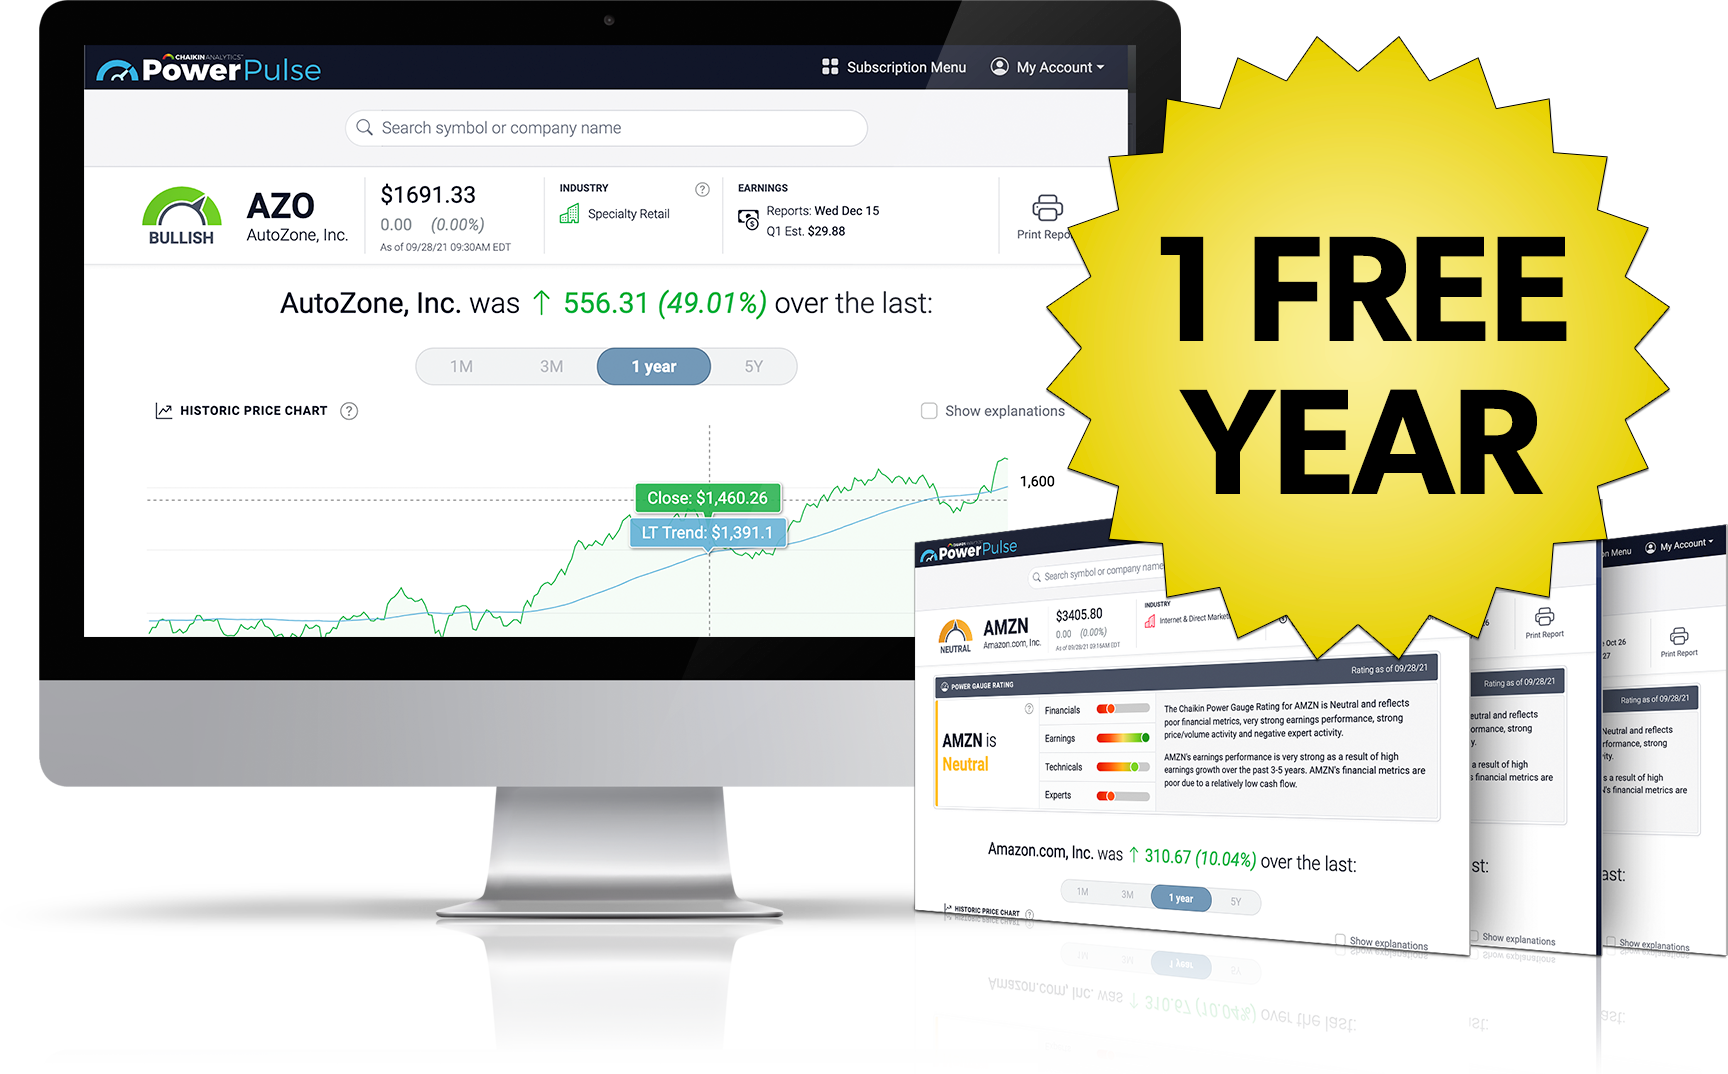
This is what it looks like when you enter the ticker or company name:
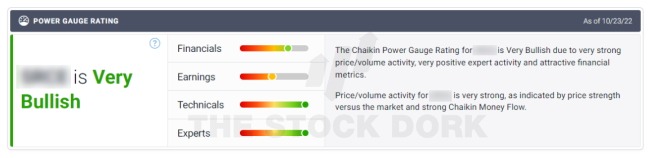
As you can see, it offers the overall outlook, with a little blurb that explains why the stock earned its rating.
If you scroll down a little bit, you are welcomed with a very clean price chart.
This price chart is set to a year, but it can go all the way to five:
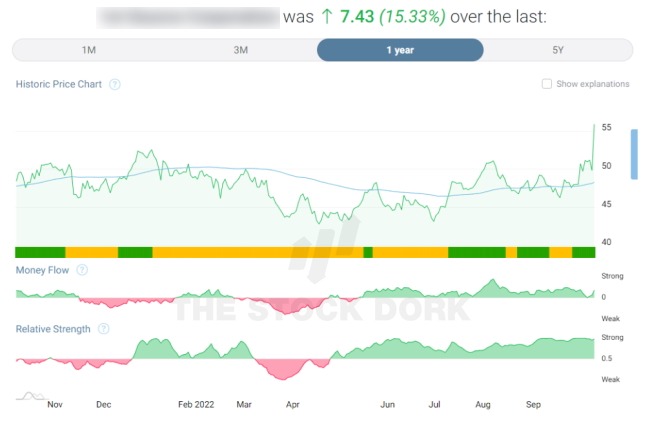
It’s very intuitive. Even better, the team has a little help icon in the top-right corner if you need more clarity.
You can also scroll the cursor around on the chart to see how well the ratings have held up over the years.
Now let’s check out the categories.
Let’s start with Financials:
- Long-Term Debt to Equity is the long-term debt divided by common equity in the most recent quarter.
- Price to Book is a ratio that divides a stock’s price by its book value per share.
- Return on Equity is calculated by dividing a company’s net income by shareholder’s equity.
- Price to Sales is determined by dividing a company’s market cap by its net income.
- Free Cash Flow is the money a company has to pay dividends or repay creditors.
This is what the Financials Rating looks like…
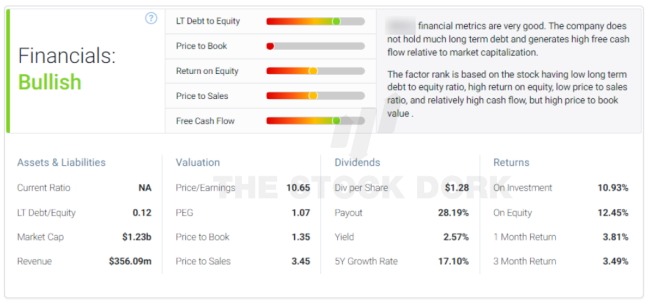
I am a big fan of these little blurbs that give you an overview of the rating.
There are also additional metrics that let you track elements such as dividends, returns, etc.
Let’s take a look over to the Earnings factors:
- Earnings Growth is determined by looking at the weighted average of the last 3-5 years of growth based on earnings per share.
- Earnings Surprise is the weighted average of the quarterly earnings per shares surprises.
- Earnings Trend tracks the change in the EPS percentage based on the last twelve months.
- Projected P/E is determined by looking at the P/E ratio of the current quarter.
- Earnings Consistency looks at the consistency of the earnings per share throughout recent and fiscal shares.
Here’s a snapshot of the rating for the company I’m tracking…
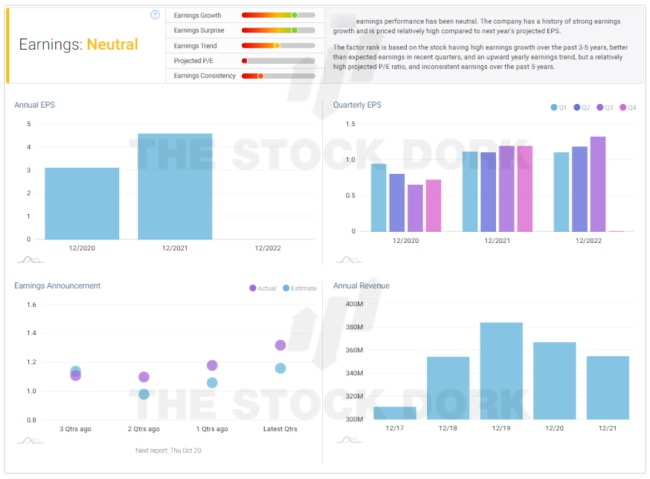
Like the Financials rating, Earnings offers additional visualizations that help you keep tabs on a company’s performance.
I touched on this before, but I really appreciate how clean and organized the visuals are. The Pulse software offers a very user-friendly experience.
Time to head over to Technicals:
- Relative Strength vs Market examines a stock’s price performance versus the S&P 500 over the last six months.
- Chaikin Money Flow is Marc Chaikin’s proprietary indicator that measures the buying and selling pressure placed on a stock.
- Price Strength tracks a stock’s closing price against its 200-day exponential moving average.
- Price Trend ROC tracks the 42-day change from a stock’s 200-day exponential moving average.
- Volume Trend is the ratio between a stock’s 30-day and 90-day average volume.
This is what the rating looks like…
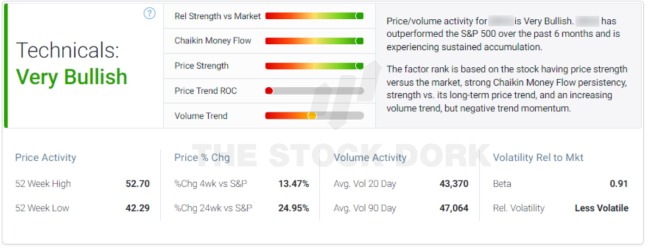
In addition to the summary block, this Power Gauge stock rating also tracks info, such as price changes and relative volatility.
Last on the list is Experts:
- Estimate Trend is the average analyst EPS estimate for the next fiscal year.
- Short Interest is determined by looking at outstanding shares that investors have sold short but haven’t covered or closed out of a position.
- Insider Activity tracks the stocks purchased by insiders within the last six-month period.
- Analyst Rating Trend measures the change in a stock’s average analyst rating over the last four weeks.
- Industrial Relative Strength tracks the performance of a sock’s industry versus the market over the last six months.
Here’s a snapshot of the Experts rating…
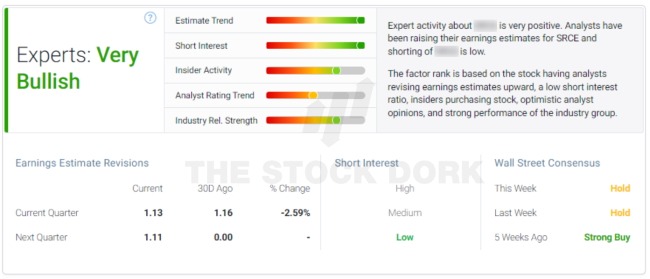
My favorite part about this rating is the bottom panels spotlighting short interest and Wall Street Consensus. It gives a clear look at the general sentiment of a stock.
As mentioned, these ratings were provided by the Power Pulse System, which is available through the Power Gauge Report.
>> Access Power Gauge Ratings through Power Pulse<<

What Is the Power Gauge Report?
The Power Gauge Report is an investment newsletter led by Marc Chaikin and published by Chaikin Analytics.
Upon signing up, members receive instant access to stock picks, bonus reports, Power Gauge Ratings, and much more.
This subscription offers its ratings via the Power Pulse System mentioned above.
I have a dedicated Power Gauge Report review if you want to know more, but it’s not required reading.
Power Gauge Report Features
The Power Gauge Report is packed with exceptional features, including the Power Pulse system.
Follow along for a look at everything on offer.

One Year of the Power Gauge Report Newsletter
Each Month, the Power Gauge Report newsletter provides members with one carefully vetted trade idea.
The team lays out their buy case with a wealth of supporting research.
Each issue also includes market commentary as well as the premiering pick’s Power Gauge Rating.
The writing doesn’t dawdle. It’s straight to the point and respects your time.
Power Pulse
Power Gauge Report members have unlimited access to the Power Pulse system throughout their subscriptions.
Simply enter a ticker or company name, and the software will offer the most current rating.
This is an excellent tool for anyone looking to do their own self-directed investing guided by Chaikin’s key indicators.
Model Portfolio
Subscribers can check in on the model portfolio at any time to stay up-to-date with all open positions.
It tracks the recommended date, price, current price, dividend payouts, and more.
Something I really appreciate about the portfolio is that if you click on the company name, it sends you straight to the buy case.
This makes it easy to jump back and forth between picks for quick research.
>> See why so many trust Chaikin Analytics <<

Power Gauge Report Bonuses
Under the latest deal, Marc Chaikin and the team are packing in even more valuable features, including additional trade ideas.
Here’s what you get:
- Marc Chaikin’s Four “Power Picks” for Retirement
- The Power Gauge: How to Double Your Money on the Best Stocks
- Special Mystery Gift
The first two bonuses are special reports and the mystery gift is an extra add-on that the team values at $1,000.
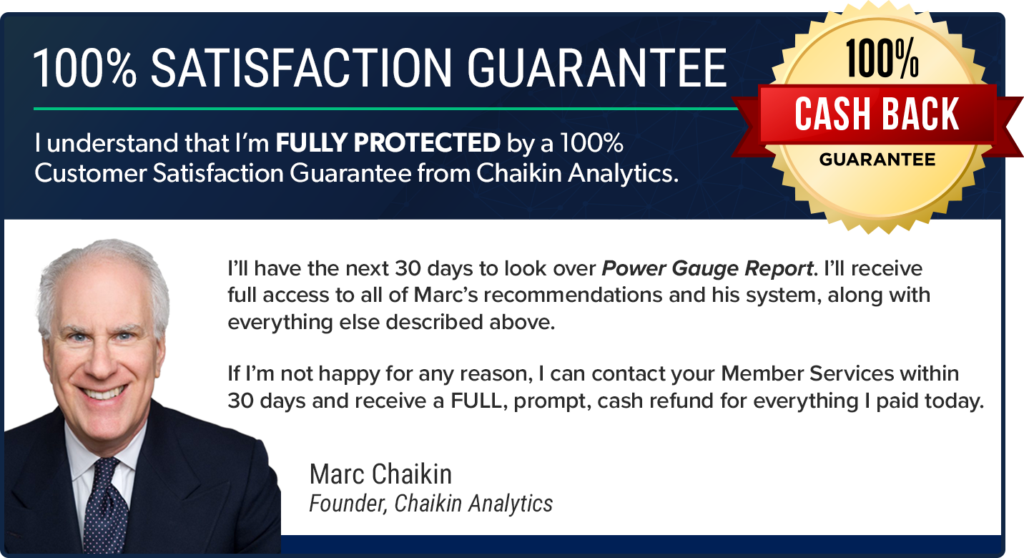
30-Day Money-Back Guarantee
Subscriptions to Power Gauge Report are backed by the team’s 30-day refund policy.
This means you have about a month to test-drive the service. If you don’t feel it’s a good fit, you can get a refund on the cost of the subscription.
Thirty days is the industry standard, so the team isn’t breaking new ground here. That said, not every service offers an actual money-back guarantee, so I will give the team extra points.
>> Join under Chaikin’s satisfaction guarantee <<
Power Gauge Report Pros and Cons
The Power Gauge comes with a lot of pros, but there are some cons to consider.
Pros
- Power Gauge analyzes 4,000 stocks
- 75% discount on the first year
- UI is sleek and intuitive
- Runs through browser
Cons
- No community forums
- Does not track crypto
Power Gauge Report Pricing
An annual subscription to Power Gauge Report typically costs $199. However, Marc Chaikin is sweetening the deal by offering 75% off for the first year.
With the discount, a yearly membership costs just $49.
This means members can access all the features of the service, including the Power Pulse System, for just 13 cents a day.

Is Power Gauge Worth It?
The Chaikin Power Gauge offers a lot of value and is well worth the money.
It’s a strong tool for technical analysis and could point to some great opportunities.
With Power Gauge Report, members can access these ratings through the Power Pulse Software.
Even better, the subscription service offers monthly trade ideas, bonus reports, and a 30-day money-back guarantee.
If you’re looking for stock market insights from a pro and access to a solid tool for technical analysis, I recommend giving Power Gauge Report a close consideration.
>> Access Power Pulse and Power Gauge Report for 75% off <<


 Tags:
Tags: