In the intricate world of stock market trading, chart patterns play a pivotal role in forecasting future price movements. One such pattern revered among traders for its bullish potential is the cup and handle.
Stock chart patterns serve as a visual diary of market sentiment. These patterns, such as the revered cup and handle, often signal a change in trends. So, what is a cup and handle pattern?
Recognized for its bullish implications, the cup and handle is a pattern every keen trader should understand to gain an edge in the market. Let’s uncover the nuances of this key pattern.
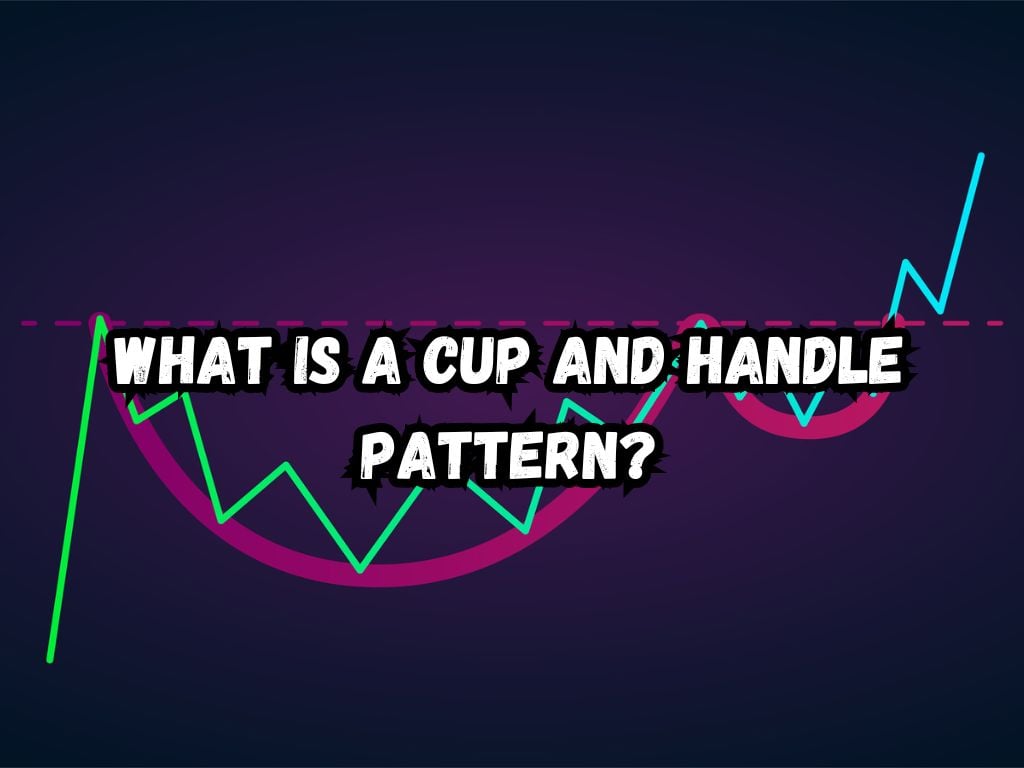
What Is a Cup and Handle Pattern?
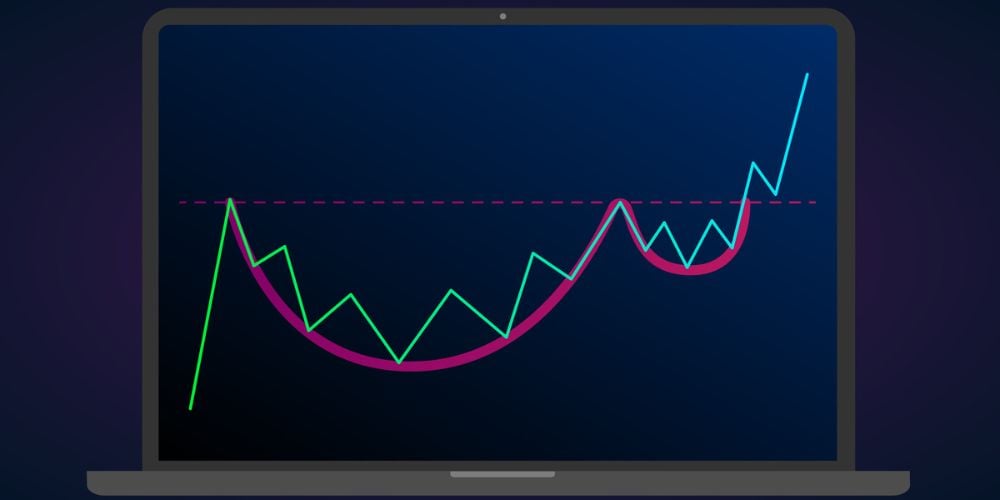
This pattern gets its name from its resemblance to a teacup. Created by William J. O’Neil, mentioned in his classic work “How to Make Money in Stocks,” the cup and handle form when a stock’s price drops and then rises to form a round bottom, or “cup,” followed by a smaller, sideways or downward movement, the “handle,” before it advances to higher prices.
This well-contemplated movement suggests preparation for a significant upwards price movement.
Characteristics of the Cup and Handle Pattern
Distinguishing a cup and handle formation involves attention to certain features:
Time Frame
A typical cup and handle pattern develops over several weeks to months. It mirrors the time investors take to reassess their views and positions in a stock, creating the characteristic round bottom.
The longer the cup, the higher the reliability of the breakout and the greater the potential for an upward price surge.
Volume
Volume plays an essential role. During the formation of the cup, volume typically trends downward. However, as the right side of the cup forms and the price starts ascending, volume should pick up.
A subsequent decrease in volume generally develops throughout the handle’s formation, followed by a significant increase during the breakout.
Depth of the Cup
The pattern’s reliability often correlates with the cup’s depth. A cup with a moderate decline from peak to bottom — usually not more than 30-50% — suggests a healthier market correction as opposed to a sharp decline.
Slope of the Cup
Ideally, the slope of the cup should be gentle. This gradual decline and ascent indicate a steady shift in market sentiment from bearish to bullish.
Handle Formation
The handle should form in the upper half of the cup and not drop into the lower half. It suggests that the price is holding strong near the highs of the cup.
Identifying the Cup and Handle Pattern
Spotting a cup and handle pattern involves looking for the specific shape on the chart.
Visual Identification
The cup part resembles a bowl or rounding bottom, and the handle has a slight downward drift. Pattern recognition can become intuitive with experience, and one may start identifying this setup across various time frames.
Technical Analysis Tools
While the naked eye can spot a cup and handle formation, confirmation may come from using technical analysis tools. Tools such as moving averages can help confirm the pattern and ascertain the breakout’s validity.

Trading the Cup and Handle Pattern
Once a trader identifies a cup and handle pattern, they must determine the best course of action to capitalize on it.
Entry Points
Entry is best made after the handle has formed and when the price breaks out above the handle’s resistance. It is the surge that validates the pattern, showing buyer commitment.
Stop Loss Orders
Setting a stop loss beneath the handle can protect against false breakouts. It limits exposure to unpredictable market swings and ensures the trader can exit with minimal losses if the trend reverses.
Profit Targets
By measuring the distance from the right peak of the cup down to the bottom of the cup, a trader can set a potential profit target. This target is then applied above the breakout point to project where the price may go following the breakout.
Common Mistakes to Avoid
Beware of jumping to conclusions. Volume is a key indicator and without its confirmation, there’s a risk of misinterpreting the pattern.
Other pitfalls include confusing similar patterns with a true cup and handle or entering trades prematurely, without the full formation of the handle.
Pro Tips
Patience is key in this area. The cup and handle pattern does not develop overnight, and recognizing this pattern requires practice and patience. By waiting for volume confirmation and considering the broader market trends, traders can make more informed decisions.
Real-World Examples
Analyzing past charts can yield concrete examples of the cup and handle pattern. Studying these historical instances helps understand the nuances of identifying and trading the pattern in real-time conditions.
Conclusion
The cup and handle formation is a robust predictor of a bullish market breakout. By familiarizing themselves with this pattern, traders level up their arsenal with a proven strategy.
It is the meticulous study of patterns like these that equips traders to navigate the treacherous waters of the stock market with confidence.
 Tags:
Tags: