
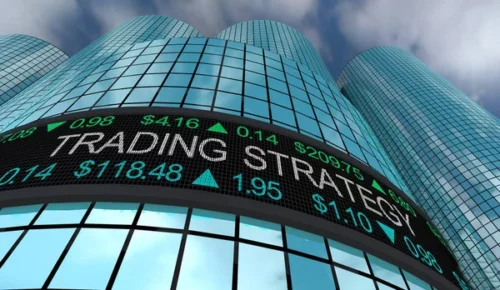
Swing traders hold positions between a few days to a few weeks, looking to maximize returns based on both sectoral and price trends. But what chart time frame is best for monitoring shares for this strategy? We looked into it, and here is what came out.
About Swing Trading
Swing trading tries to make profits by capturing the gains over the short and medium duration from investments in the financial markets.
It is a strategy that lies somewhere between day trading and long-term investing.
In this method, most folks hold their stocks for anywhere between a few days to weeks.
Swing traders use fundamental and technical analysis to identify swing trading opportunities and enter positions.

They try to capture the maximum profit from upward and downward chart movements and sectoral trends.
Moreover, unlike value investing, swing trading is often about making timely exits.
These investors maintain a clear expectation of percentage returns and leave their position as soon as it is achieved.
They don’t enter long-term positions hoping to ride the company’s success over many years.
How Many Trades Do Swing Traders Take a Month?
On average, if an investor can execute about 20-22 swing trades a month (one per day), that would be considered optimum.
Of course, there is no limit to how many deals one can make.
However, two things constrain investors:
- Length of time for which each share is held
- The number of simultaneously open positions.
Typically, a swing trader would wait a few days to weeks to maximize profits.
Keeping a stock for too long restricts them from using the cash elsewhere, reducing the number of deals.
The second point is more to do about manageability.
Maximizing the value of a trade requires at least some time and effort nearly every day.
Having multiple holdings makes it harder to dedicate attention to each open position.
Beyond a point, it is just too difficult to carry more than a certain number of simultaneous positions without making mistakes.
While this factor varies individually, it puts a maximum cap on the number of trades possible for every trader.
Best Time Frame for Swing Trading?
The 4-hour and 1-hour swing trading time frames are the most popular.
Using a window less than that would be more suitable for day trading.
Of course, the best timeframe is often subjective.
What works for one investor may not be right for another.
It also depends on the frequency with which they want to open and close positions.
Those who prefer to enter and exit within five to ten sessions may find the 1-hour window better.
Instead, if the investor wants to carry the position for ten to fifteen sessions, the other option might be more suitable.

How much effort all this requires is another factor to think about.
For those who cannot spend more than 2-3 hours a week on swing trading, it is best to use a longer window.
Lastly, many professional traders do not restrict themselves to only one of these two.
They use multiple time frames, each for a different purpose.
For example, the H4 might be best suited for market scoping, but a longer one may be needed to understand price action and do fundamental analysis.
For entering a particular swing trade position, the M5 or M30 (5 and 30-minute) are also popular.
Keep in mind, though, that trading costs are higher as the duration of monitoring shortens and vice versa.
Is 4-Hour Chart Good?
Yes, the 4-hour chart is often considered the best for swing trading.
It is a good window for those looking to hold their positions for about 10 to 15 sessions.
If the frequency is going to be higher, it may be more advantageous to consider a shorter one.
The 4-hour frame aligns with our earlier idea that 20 trades a month is a good number for swing trading.
Any more, and the investor would move into the day traders category!
Is a 1 Hour Time Frame Good?
Yes, the 1-hour swing trading time frame is good, especially for those looking to hold their positions only for 5-10 sessions.
This window is also suited for identifying a precise entry point or a stop loss/take-profit level.
Using the 1-hour or shorter time frames makes it possible to maximize returns by capturing the majority of price movements.
How Many Hours a Day Do Swing Traders Work?
While it varies for each individual, swing traders typically work 2-3 hours daily in the markets.
This trading strategy is usually suitable for working professionals because it does not take up the entire day.
Most professional traders begin their day around 6 am, before market opening.
In the early morning, they make preparations for the day, including:
- Catching up on news events that might impact the day’s trades
- Identifying potential stocks to trade during the day
- Shortlisting and creating a watchlist
- Checking up on their existing portfolio
After setting up things, they wait for the market opening bell.
When markets are active (9:30 am to 4 pm), their task is to implement the trading strategies they have decided for the day.
Most of this involves watching the market data and entering and exiting when the time is right.
Swing trading usually does not happen after hours because of the lack of liquidity.
Most traders use this time to record their transactions and evaluate performance.
Can You Get Rich Swing Trading?
Yes, it is possible to get rich swing trading, but very few people (only about 2-3%) can actually make enough to live on it.
The reason is that most traders either do not take the time to understand the basic principles or get disheartened too quickly by losses.

What Is the Success Rate of Swing Traders?
Many online estimates suggest that only about 10% of swing traders are successful in at least breaking even on the stock market.
This is comparable to the success rate of day trading and value investing.
While the method is not very complex, there are reasons beyond the technical aspects that lead to such a low success rate.
We cover some of them in the next section.
Why Do Most Swing Traders Fail?
There are many reasons why swing traders might fail, such as a lack of understanding, giving up too easily, emotion-based decision-making, or not using the right tools.
Firstly, most traders like to jump into action without fully understanding the trading strategies and how to implement them.
Another reason is getting disheartened and giving up too easily.
Investors should realize that positive results are not possible in every trade.
Rather, it is best to aim for a target profit ratio over a longer time frame, such as a month or even a year.
Making irrational or emotion-driven decisions is another factor that causes losses in swing trading.
It takes some time and experience before investors can divorce their feelings from buying and selling stock.
As we explained earlier, holding on to a position for too long impacts the ability to execute other trades by reducing the cash available.
Lastly, many people try to eyeball charts, data, and news events.
It is best to get professional tools to help you organize, analyze and draw conclusions from data for swing trading.
What Is the Best Strategy for Swing Trading?
While investors employ many swing trading strategies, here are two that are the most popular.
Fibonacci Retracements
This method sets up support and resistance levels on a stock chart based on the well know Fibonacci ratios of 23.6%, 38.2%, and 61.8%.
Some traders also use the 50% level.
These points are considered strong candidates for reversal levels on a price trend.
For example, a trader could set up a short position when a share reaches 61.8% of its previous high, expecting it to bounce back down upon reaching the resistance level.
Once it nears the support of 23.6%, it is time to exit after profit-taking.
10- and 20-day Simple Moving Average (SMA)
This is perhaps the simplest and most widely used swing trading strategy.
An SMA is just the average of the closing prices of a share over the last few days.
The 10-day SMA gives a more recent picture, whereas a 20-day one represents a longer trend.
This strategy monitors how the former is placed with respect to the latter on the price chart.
If the 10-day average is higher, the stock is in an upward trend and vice versa.
Accordingly, the investor can set up short or long positions.
Final Thoughts
Swing trading is often preferred by working professionals because it does not require more than a 2-3 hour per day commitment from them.
On average, making one trade a day is considered pretty good for this trading style.
That is why the 4-hour and 1-hour time frames are usually considered best for swing traders when it comes to tracking the market.
The former is better for those looking at the 10-20 session horizon. Folks who prefer to exit positions in 1-2 days should use the latter.
However, most successful investors do not restrict themselves to a single trading time frame.
They use each one for a different purpose.
The shorter ones help track price movements, while longer ones are better for monitoring broader trends.


 Tags:
Tags: