
Chaikin Money Flow (CMF) is an indicator to discover emerging stock trends. But does it provide real market insights? Stay tuned to find out.
What Is the Chaikin Money Flow Indicator?
The Chaikin Money Flow indicator is a sophisticated formula created by Marc Chaikin that analyzes a stock’s buying pressure and selling pressure over a set period of time.
While the default technical analysis length is 21 days, the Chaikin Money Flow can be run for any duration.
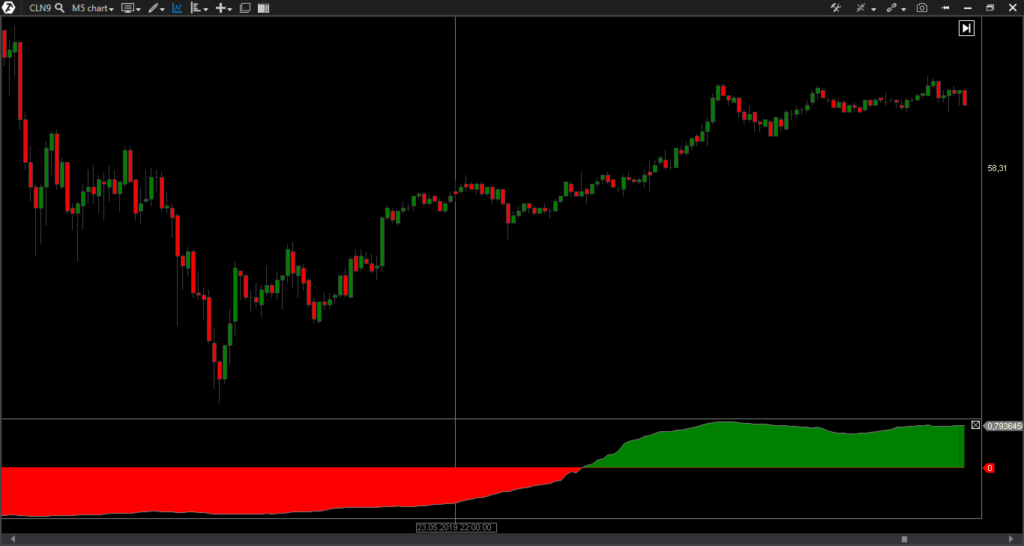
The corresponding chart represents a money flow oscillator that dances above or below a zero line.
Values on the Chaikin oscillator can range from 1 to -1 depending on their location compared to the zero line.
Depending on where the CMF lands on the chart, it may speak to a buy or sell scenario if the indications are there.
What Does Chaikin Money Flow Indicate?
As touched on earlier, the Chaikin Money Flow chart looks at the buying pressure and selling pressure of shares.
The stock is typically doing well when the oscillator is above the zero line.
A positive money flow indicates an influx in buying pressure, bringing with it higher demand and buyers willing to pay a higher price.
Eventually, lower demand could result in a zero line cross into the lower half of the money flow chart.
As the Chaikin oscillator falls into the red zone, selling pressure increases.
It’s here that most stock selling takes place as the market price could be in a position to decrease.
Over time, less selling pressure typically leads the CMF indicator back into the upper half along with an appealing price move.
Keep in mind that CMF values must be studied over a length of time to sniff out trends.
A value that jumps above the zero line for a day doesn’t immediately spell out a buy situation, as the CMF could fall back below tomorrow.
Several days of CMF values moving up or down are the best indicators of an actual event worth considering for investment or sale.
Is Chaikin Money Flow a Lagging Indicator?
The CMF indicator relies on a stock’s price movement over the course of a specific period for calculating Chaikin Money Flow.
The price point where a stock closes is an essential part of the formula.
As a result, the Chaikin Money Flow Indicator does lag behind the market by the equivalent of a day.
However, keep in mind that the chart represents a trend direction that needs to be studied over a larger interval.
>> Get access to exclusive research from the man behind CMF himself. Sign up here! <<
What Is the Best Money Flow Indicator?
The Chaikin Money Flow Indicator stands out as one of the best of its kind.
Many folks on Wall Street regularly use this popular tool to corroborate their investment strategies.
By focusing on trends created as the CMF moves above and below the zero line, it’s possible to predict changes in share price in both upward and downward directions.
CMF is effective because it relies on data collected from stocks over a 21-day window.
It compares how volume shifts depending on where stocks close in relation to the day’s high and low.
Although not foolproof, a positive CMF value can indicate a buy situation, where a negative value typically reveals an opportunity to sell.
In short, it’s a solid indicator, but it’s typically used as one part of a comprehensive market strategy.
We’re going to break the CMF down in more detail.
But first, who is Marc Chaikin?
Who Is Marc Chaikin?
Marc Chaikin is a highly respected investor and stock market research Guru.
He has over a half a century of investing experience and has developed a suite of market analysis tools and strategies.
Some of Chaikin’s other indicators include:
- Accumulation/Distribution Line
- Chaikin Volume Accumulator
- Chaikin Oscillator
- Chaikin Power Gauge
Along with his wife, Sandy Chaikin, Marc runs a well-known research firm, Chaikin Analytics.
The firm provides a catalog of research services for folks of all investing levels, which include:
- The Power Gauge Report – research and newsletter
- Power Gauge Investor – research and newsletter
- Chaikin Analytics System – research suite
- Power Pulse Premium – Power Gauge Access
- Chaikin Power Feed – research and newsletter
These services provide insights into Marc Chaikin’s market predictions, and cue you into opportunities that he believes could have potential.
Now that you know more about the CMF’s creator, let’s take a deeper look into how to use the Chaikin Money Flow Indicator.
>> Sign up now to access exclusive research from Marc Chaikin <<
How Do You Use Chaikin Money Flow Indicator?
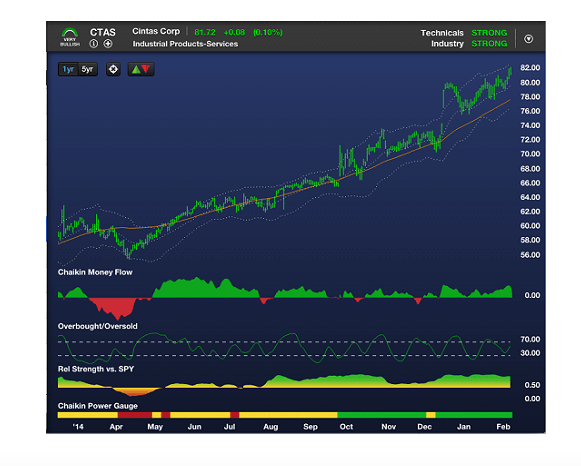
The Chaikin Money Flow Indicator is best viewed alongside a stock’s regular share price chart.
As a security’s price continues to fluctuate over time, the CMF captures daily money flow based on its high-low range.
A CMF of less than one shows a negative money flow due to selling pressure and funds leaving the stock.
Increasing daily money flow brings money back to the stock, creating buying pressure instead.
Locating Trends
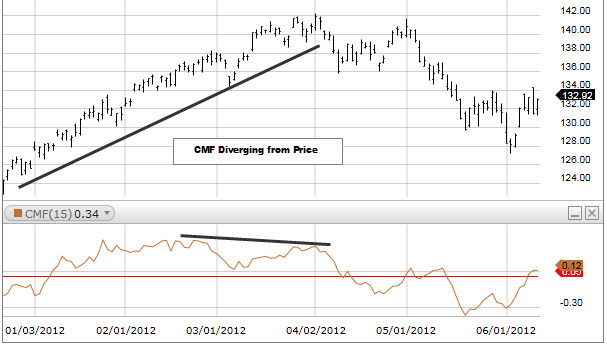
The trick to making the most of the CMF indicator is looking for trends that don’t match up with what the share price is doing.
For instance, it’s considered a bullish divergence when share prices continue to drop, but CMF remains the same or starts to climb.
Such a situation may reveal that an upward trend is about to take place with the particular stock.
Even when a stock’s price is on the rise, a positive CMF value can indicate that prices will continue to rise and could still be a good opportunity to buy.
Consequently, a stock in a dip alongside a negative CMF value may reveal that the stock is still going to drop further.
While nothing in any trading session is ever certain, these events could spell investment opportunities that would otherwise go unnoticed.
Crossing the Line
Any time a value crosses the zero point on the CMF chart, it’s worth a closer look.
These events may hint that a stock is changing directions for better or for worse.
Moving from a negative CMF to a positive could reveal that a stock has bottomed out and will start climbing in share price again.
The opposite could be true as well and can help avoid situations where an investment could lead to a loss.
Chaikin Money Flow Formula
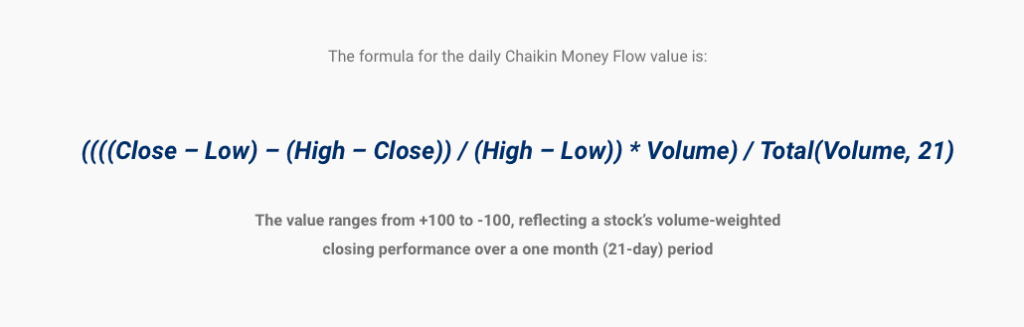
The formula that Chaikin Money Flow uses is simple to calculate and evaluates price moves throughout a given day for calculation.
There are three steps to generating a CMF value, using a money flow multiplier, money flow volume, and 21 days’ worth of share price action data.
Calculating the Money Flow Multiplier
The Money Flow Multiplier is a value that reveals whether the closing price is in the upper half of the stock’s high-low range or the lower half.
Calculating the multiplier requires the following formula:
Money Flow Multiplier = [(Close – Low) – (High – Close)] / (High – Low)
The multiplier always yields a number between 1 and -1, with a positive result indicating the closing price of a particular security might be closer to the high.
Anything with a negative value puts the closing price nearer to the share’s daily low, and a zero puts it right in the middle.
Ideally, the Money Flow Multiplier would be positive, showing upward trend strength.
A multiplier of 1 means the close and the high are the same for the given day.
Calculating Money Flow Volume
Money Flow Volume takes the multiplier value and multiplies it by the stock’s volume for the same day:
Money Flow Volume = Money Flow Multiplier x Volume at Close
Since it’s almost always multiplied by a fraction, the Money Flow Volume usually ends up lower than the actual volume for the day.
These Money Flow Volumes over a 21-day interval will form the core of the Chaikin Money Flow Value.
Calculating Chaikin Money Flow
To obtain an actual money flow value, average the MF volume against the actual volume of a stock over a set interval.
A Chaikin Money Flow covers a 21-day window, representing a month of trading.
The final formula looks like this:
CMF = 21 Day Sum of Money Flow Volume / 21 Day Sum of Actual Volume
CMF represents one point on the Chaikin oscillator that, along with other exponential moving averages, reveals trend lines for a given stock.
In turn, the chart captures positive or negative money flow as the CMF crosses above or below the zero line.
Pros and Cons of the Chaikin Money Flow
The Chaikin Money Flow Indicator is a powerful investing tool, but it does have a few drawbacks.
Take a look at the pros and cons of the CMF indicator.
Pros
- One of the top technical indicators
- Accurate at picking up on buying and selling pressure
- Uses exponential moving averages in calculations
- Useful during trending markets
- Can offer a sell signal when trend lines may change
- Helps confirm the strength of a trend for investment purposes
- Works with low or high-volume stocks
Cons
- CMF indicator does lag the price
- Quick zero line crosses can lead to false signals
- Should not be used as a stand-alone indicator
Is Chaikin Money Flow a Good Indicator?
Chaikin Money Flow can be a good indicator to use whether you’re looking at a high- or low-volume stock.
The indicator doesn’t stand well on its own but relies on share price over time to pick up on a future shift.
By tracking down potential trends in share prices, the indicator functions as a timing tool to identify when an upward or downward shift may occur.
Being at the forefront of these changes in direction could spell impressive gains or avoid pitfalls that lead to lost income.
There’s no absolute science in predicting where share prices will go.
So you may want to use Chaikin Money Flow as a supporting feature of your trading strategy — rather than using it as the only indicator in your investment analysis.
>> Want EXCLUSIVE insight from Marc Chaikin using CMF? Click HERE to sign up! <<
 Tags:
Tags: