Improving your portfolio by knowing where and what to invest in is challenging, especially if you don’t know how to measure price gains and declines in stock markets based on points. So what is a point in the stock market, and why is it important? Read on to learn just that!
A Point in the Stock Market
While the stock market is constantly changing and reacting to different news and events happening worldwide, it’s essential to understand what a stock point is and how it can affect the market.
Generally, a point in the stock market is simply the smallest unit of change in a stock’s price. It is a unit of measure usually used to describe investment returns or losses. It is generally done to describe short-term results, such as for the day, week, or even a month.
Aside from measuring individual stocks, it is also often used to measure the performance of a stock, or a group of stocks, over time. They can also be used to compare the performance of different stocks against each other.

Stock points can also be either positive or negative, depending on the stock’s price movement. A positive point means that the stock’s price has increased, while a negative point indicates that the stock’s price has decreased.
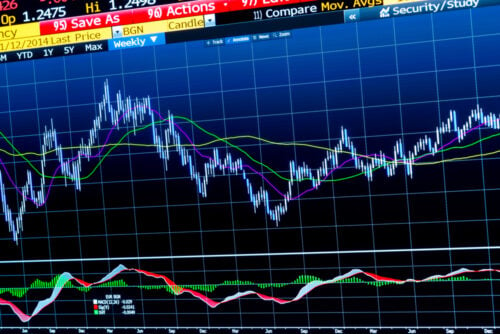
The concept of points is also valuable for technical analysis, especially in interpreting stock charts, where they are often used to identify trends and support and resistance levels. These stock charts can be used to visualize the price movement of a particular stock over time, and they are often measured in points.
For example, if a stock’s price moves up and down in a particular pattern, it may be “trading in a range” or “forming a base.” If the stock’s price is consistently moving in one direction, it may be said to be “trending.”
Understanding these concepts can help you better interpret stock charts and make more informed investment decisions.
How to Measure Returns and Losses with Points
As an investor, you’re always looking for ways to improve your investment strategy and get the most out of your money. One way to do this is to learn how to measure returns and losses with points.
While there are several different methods for calculating returns and losses, using points is a simple and effective way to track your progress. Below is how to measure returns and losses with points.
Determine the value of each point
For stocks, one point is equivalent to one dollar price. For example, if you invest $100 and the stock goes up by one point, your return would be $1.
Calculate your total points
To do this, simply multiply the number of shares you own by the value of each point. So, if you own 100 shares and each share is worth $1, your total points would be 100.
Determine Your Percentage Return
To calculate this, divide the total points by the number of shares you own. In our example, this would be 100 divided by 100, which equals 1%.

Convert Your Percentage Return into Dollars
Simply multiply your percentage return by the investment amount to convert your percentage return into dollars. In our example, this would be 1% multiplied by $100, which equals $1.
Determine Your Loss or Gain
Subtract your original investment amount from your current investment value. So, if the stock is now worth $101, your gain would be $1. If the stock is now worth $99, your loss would be $1.
Stock Point and Percentage Gains
Points are not percentages. Although points and percentages are two ways to measure how much a stock has risen or fallen, points refer only to the dollar amount that has changed, not the percentage.
That is, points refer to the absolute change in the price of a stock, while percentage changes refer to the relative change in the price of a stock.
While one point is always equivalent to one dollar in the stock market, the percentage worth of a one-point movement for two companies can differ. Two stocks can lose the same number of points but very different percentages.
Also, one must not confuse a point with a percentage or basis point (bps). As percentage is calculated based on the stock’s starting value, the significance of a point drop is dependent on how high the share price is.
For example, a stock might lose five points, which is a 5% loss if it was trading at 100. But if the stock were trading at 10,000, that same five-point loss would only be a 0.05% loss.
This is why, when it comes to stocks, percentage can be a more critical metric than points. After all, a 5% loss is much more significant than a 0.05% loss, even if the point loss is the same.
So, when considering how much a stock has lost, it’s essential to look at both the number of points and the percentage as it is not the only stock point that matters.
What Determines the Stock Points?
The stock points are determined by a number of factors, including the company’s share price, the number of shares outstanding, and market capitalization. Other factors, such as the earnings per share and the price-to-earnings ratio, may also be considered.
The stock points can also be affected by changes in the overall market conditions. For example, if the overall market is in a downturn, the stock points may be lower than they would be during a period of economic growth.

How Do Points Affect Stock Prices?
How points affect stock prices is an essential question for any investor. While there are many factors that can affect stock prices, the relationship between points and stock prices is important.
There are a few different ways that points can affect stock prices. First, the market will react to the news when a company reports earnings. If the earnings are better than expected, the stock price will increase. On the other hand, if the earnings are worse than expected, the stock price will usually go down.
Another way is through interest rates. When interest rates go up, it generally hurts stock prices. When interest rates go up, it becomes more expensive for companies to borrow money. This can lead to lower profits and, as a result, lower stock prices.
Finally, points can also affect stock prices through the supply and demand of shares. If there are more buyers than sellers, the price of the stock will go up. On the other hand, if there are more sellers than buyers, the price of the stock will go down.

The Largest Point Drop and Gain in Market Indexes
While points are used when discussing individual stocks, they are also often used to describe equity indexes’ short-term fluctuations. Let’s take a look at some of the largest point drops and gains in the stock market.
The Dow Jones Index Value
The Dow Jones Industrial Average (DJIA) suffered its worst stock market crash in over three decades on March 16, 2020, as the index plummeted more than 2,997 points amid fears of the coronavirus outbreak and stock markets under pressure.
The Dow was down around 1,000 points in early trading on that Monday before falling sharply in the afternoon. At its lows, the index was down over 2,997 points, or nearly 6%, before recovering some ground to close at 23,851.02, down 2,113 points, or 4.1%.
The drop marks the biggest point decline for the Dow ever and the largest percentage drop in the index was on October 19, 1987, known as the Black Monday, when the Dow fell over 22.5% in a single day. This was followed by the largest one-day percentage gain on October 13, 1989, when the index rose 19.1%.
The S&P 500 and Nasdaq Composite Index Value
The S&P 500 and Nasdaq Composite present the same point movement, having fallen sharply expressed in percentage terms, with the S&P 500 closing down 11.98% and the Nasdaq Composite falling 4% (970.28 points loss) on the same day as The DJIA index, March 16, 2020.
What is a Point in the Stock Market? Final Thoughts
Understanding the most used and most basic stock market terminology “point” should be one of the steps any investor must do before entering the market and attempting to make a profit.
One could only know how to measure returns and losses to keep track of one’s progress as an investor if one understands the logic behind stock points. This way, the investor could improve their stock market performance and find greater opportunities where and what to invest.
By understanding how to measure returns and losses with points and trends in the indexes, you can make better decisions about where you could efficiently make a profit and how to manage your portfolio.


 Tags:
Tags:


