With today’s complex and volatile markets, it is challenging for traders to keep up with the barrage of information coming their way along with the countless strategies they can execute while trading. Luckily, having the right technical indicators in your arsenal can simplify the work that needs to be done.
These technical indicators are used by traders to gain valuable insight into market behavior and the level of supply and demand. These indicators can also provide buy and sell signals making it possible to time the best entry and exit points to maximize profit.
These indicators allow you to build a reliable trading toolkit that you can trust as you grow your knowledge of the market. In addition, they are easy to find and use on some of the most popular trading platforms. With that in mind, here are the top 5 technical indicators you need in your trading toolkit.
1. Fibonacci Retracement Tool
The Fibonacci retracement tool is one of the must-haves for traders for a number of reasons. This tool provides a series of levels where the trend could pause and then continue or reverse. In trading, the most common Fibonacci levels or ratios are 23.6%, 38.2%, 50%, 61.8%, and 78.6%.
The concept of Fibonacci retracements is attributed to Leonardo Fibonacci and in the 1970s, traders began learning how to use the fibonacci retracement tool in their charts. This garnered much success as they discovered Fibonacci retracements, and identified support and resistance levels that helped to navigate the volatility of the market.
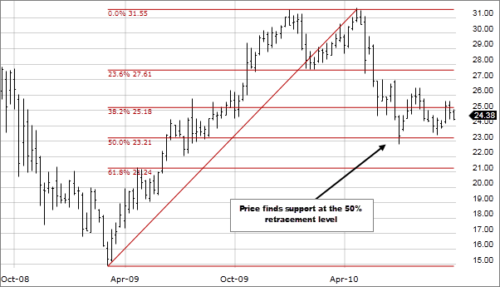
The unique attribute of Fibonacci retracement is that it doesn’t have a precise formula. So, drawing a Fibonacci line manually can be a bit challenging and if drawn poorly, it can lead to wrong conclusions and affect your whole trade. Luckily, most platforms have the Fibonacci tool built in so you don’t have to draw lines and levels manually.
How to Use the Fibonacci Retracement Tool To Trade
There are several ways to incorporate Fibonacci retracement into your strategy. However, there are two major ways of utilizing this tool:
Breakout Trading
When a breakout happens, the market experiences new highs and lows and usually happens when the price reverses after moving in a specific direction and breaks a previously unbreakable level.
Use Fibonacci retracement to find the area where the asset is bound to reverse or bounce and it doesn’t matter if you are trading with or against the trend. However, some traders only trade the breakouts because they prefer to be on the safe side and pick the profits after the price has already reversed.
Other traders tend to act differently and would not wait for the price to reverse before they trade. For traders who take this approach, it is advisable to use Fibonacci retracement to set stop loss and take profit levels as a safety measure.
After executing a buy order, place a stop loss order below the next Fibonacci level but place it above the next Fibonacci level if a sell order is executed. This way, losses are minimized if the trend reverses.
Range Trading
When the price of an asset moves between two established zones, a range is established. The Fibonacci retracement tool can be used to mark these key zones. Most times, the price will hit the resistance zone when it hits the highlighted retracement levels.
For this strategy, traders use Fibonacci to create established zones and take advantage of the range within that zone. This way you can take the most profits from some of the best day trading stocks or currency pairs without too much effort.
You can buy whenever the price reaches the support level and sell once it reaches the resistance zone. But once the price breaks out of either the support or resistance level, you can switch to a different strategy.
2. On-Balance Volume
The On-Balance Volume Indicator is a momentum technical indicator that uses the positive or negative flow of trading volume to show the level of buying or selling pressure on a security.
In other words, this instrument of technical analysis measures the rate at which a stock is bought and sold in a day and the information obtained is used to predict possible trends.
OBV is a popular indicator on trading platforms like MetaTrader 5 but it is simple to calculate if you want to do it yourself. The basic formula looks like this:
Previous share volume + Present Volume =OBV
Take, for instance, that stock closed today at around 5,000,000 in volume, and the previous share volume is approximately 20 million. To get the OBV, the current volume, which is 5 million, will be added to 20 million and the resulting 25 million will be the OBV.
How OBV Is Used
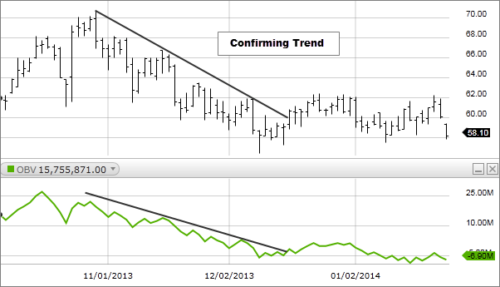
Investors use OBV as an additional indicator to identify trends at their early stages. Before the trend becomes fully established a momentum indicator like OBV, can show the formation of such a trend and how profitable it will be.
Where the OBV indicator experiences an increase, investors can expect an uptrend to take place, and when there is a decrease in volume, it is a signal that the stock’s price is expected to fall.
Although a rise in the volume of an OBV could mean a rise in price, there are situations where the indicator and price movement do not align. This is known as a divergence.
A divergence occurs when the price movement and indicator are moving in different directions. Investors and technical analysts usually interpret a divergence as a possible price reversal and take advantage of the top breakouts of any given asset.
For example, in a situation where the price continues to rise, and the OBV falls, in most cases, it is a sign that the price might experience a downtrend and an opportunity to sell the stock or hold. Where the OBV rises and the price falls, it is also seen as a signal for investors to expect a reversal and buy the stock.
3. Moving Average Convergence Divergence
Moving Average Convergence Divergence or MACD for short is an indicator that shows the changes in a price’s momentum. It collects data from two or more moving averages to identify profitable opportunities around support and resistance levels.
Convergence occurs when two moving averages move toward each other. On the other hand, divergence occurs when these moving averages move away from each other. In other words, the MACD helps to show if an asset is being extensively overbought or oversold.
MACD might seem complicated at first since it relies on an additional concept called Exponential Moving Average but it is a pretty straightforward indicator. In addition, it is a common indicator built into popular trading platforms like Robinhood.
How to Use the Moving Average Convergence Divergence (MACD)
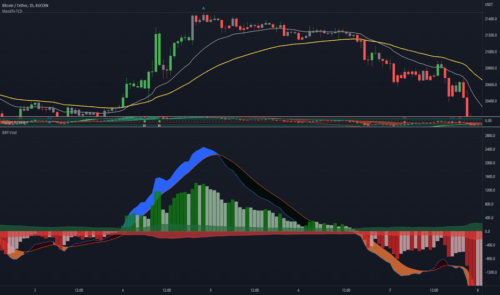
The default MACD settings used by most traders are 9-day EMA, 12-day EMA, and 26-day EMA. The MACD is calculated by subtracting the 26-day EMA from the 12-day EMA. The result of this is known as the MACD line. The 9-day EMA of the MACD line is called a signal line which functions as a buy or a sell signal.
When the MACD line crosses above the signal line, traders may buy the security but if the MACD line crosses below the security can be sold. This indicator can be used in different ways but is mainly used to determine crossovers, divergences, and rapid rises and falls of prices in the most volatile stocks, crypto, or currency pairs.
One main problem of the MACD is the possibility of providing false signals. It can signal a positive reversal but the predicted reversal never happens to lead to a false positive. This is why it should not be used alone but combined with other indicators like Average Directional Index and Directional Movement Index.
4. Relative Strength Index
Relative Strength Index or RSI is a reversal indicator used to measure the strength of price changes. It is also good for finding overbought and oversold levels when trading. With this, you can predict when a trend reversal is going to happen in a shaky market.
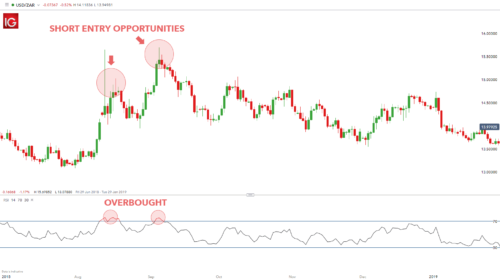
The RSI oscillates between 0 and 100 and where the RSI value of an asset goes about 70, it is considered to be overbought but if it falls below 30, it is an oversold asset. When it signals that the asset is overbought, you can sell.
RSI is usually combined with MACD and Moving Average crossovers, to confirm price reversal signals and help you identify price reversals quickly.
Best Uses of the Relative Strength Index (RSI)
RSI can indicate potential trend reversals. Where the price of an asset has higher highs and the RSI attains lower highs, this results in a bearish divergence and can be taken as a signal that there will be a potential downtrend.
But when the asset has lower lows and the RSI forms higher lows, a bullish divergence takes place and there will be a possible reversal into an uptrend.
Although it is a useful indicator for spotting trend reversals, the RSI has its limitations when it comes to a long-term trend and it is more effective when combined with other indicators like the one discussed above.
5. Stochastic Oscillator
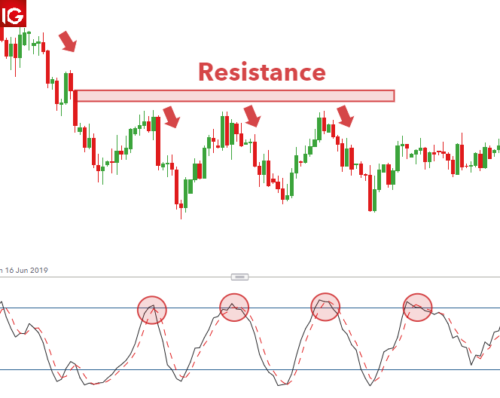
The stochastic Oscillator compares the most recent closing price of an asset to the highest or lowest price within a specific period. It measures the degree of change between prices to predict the continuation or end of a trend. Since it utilizes the past history of an asset, it is a useful indicator of overbought and oversold conditions.
The Stochastic is scaled from 0 to 100. For instance, if the stochastic reading is above 80, it shows that the asset is overbought. However, if the reading is below 20, then the security is oversold.
In addition, the stochastic oscillator indicates when a divergence is going to happen. For example, if the oscillator fails to reach a new high but the price is high, it indicates that the momentum of the uptrend is falling.
On the other hand, when the market price reaches a new low but the oscillator does not give a low reading, it indicates a bullish divergence.
Limitations of the Stochastic Indicator
The major shortcoming of this momentum indicator is its tendency to generate false signals. Keep in mind that the indicator is primarily designed for the strength or weakness of price action and not the trend itself.
Therefore, it is important to confirm the signals generated by the oscillator with other indicators.
Final Words
These are some of the best technical indicators that can help you build an effective trading kit. All of these indicators give you an idea of the volume, momentum, volatility, and direction of the asset to help you make good trading decisions.
Always use more than one indicator when trading and don’t be afraid to add new indicators to your toolkit as you become more familiar with the market and develop your own trading style.

 Tags:
Tags:


