
Knowing where to invest is hard, especially if you don’t know your way with the stock market. Correct technical analysis of stock charts and trend lines is needed to survive in trading, but how and where do you start? Here’s how to read the stock market.

Reading the Stock Market
The stock market can be confusing, especially for those who are new to investing. Getting started with investing can seem challenging with the different terms and concepts that can be difficult to understand.
Reading stock charts is not as complicated as it may seem. With a little bit of research and practice, anyone can learn how to read the stock market and make informed investment decisions.
It is crucial to have a good understanding of the risks involved in trading stocks. This includes commissions, margin requirements, and the potential for loss.
If you are on the game for some time, then reading the stock market and understanding trends can be a piece of cake for you. But regardless of your experiences, stock chart reading, up-to-date stock market news, and analyst reports comprehension can be the best tools to get that performance you are eyeing for.
What is a Stock Chart?
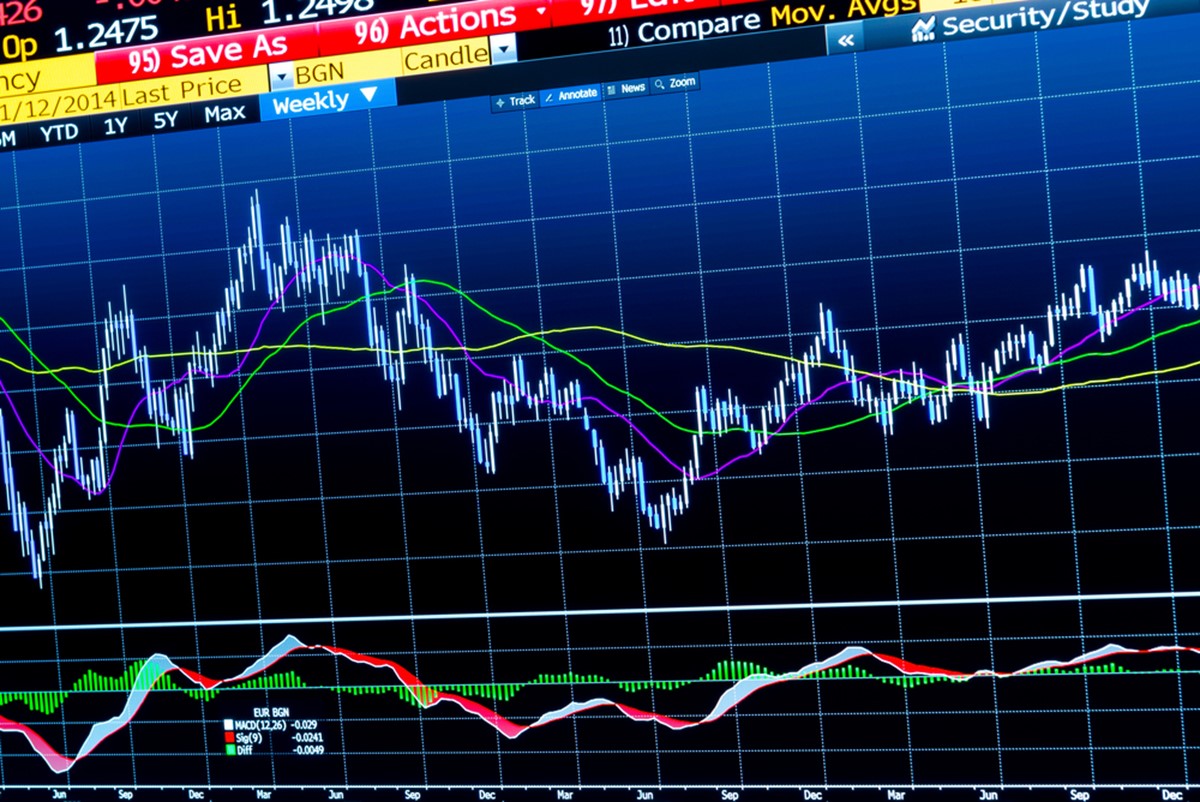
A stock chart is a graphical representation of how a particular stock has traded. The chart can show the stock’s price movement and the volume of shares traded. Investors and analysts use it to assess a company’s financial health and performance, identify trends, and support technical analysis.
Charts can be created for any timeframe, from one day to multiple years. They can show price action differently, including the most common candlesticks, bars, lines, points, and figures. Stock charts can also be helpful for both short-term and long-term investors.
Line Stock Charts
Line charts are the simplest type of stock chart component, and beginners often use them. It can show trends in data like stock prices, such as whether the stock price is rising or falling or economic indicators.
There are many different ways to create a line chart, but the most common way is to use a line graph produced by connecting data points with a line. Line graphs can show stock price movement and the current stock prices compared to the last price and other economic indicators.
Another way is to use a scatter plot, a graph that uses dots to represent data points. These scatter plots can show relationships between two or more variables.
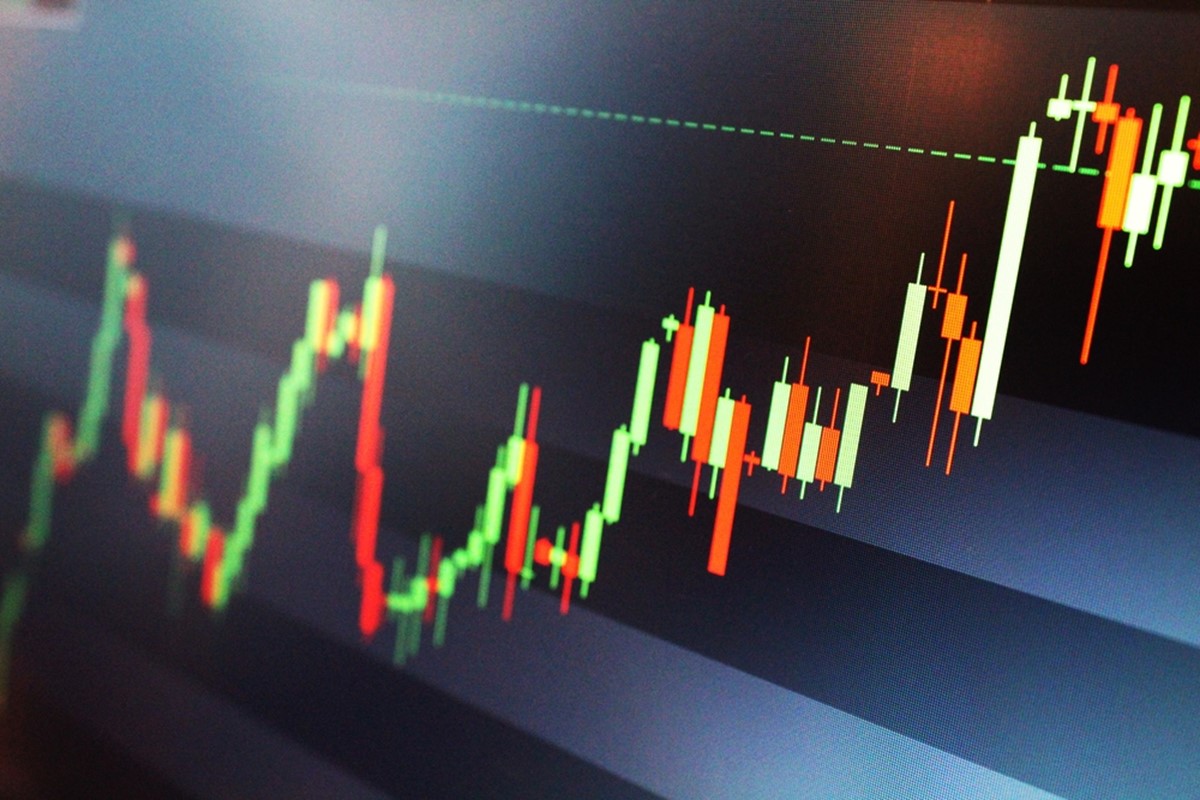
Candlestick Stock Charts
A candlestick stock chart is a type of financial chart showing the open, high, low, and close prices for a security over a set period. Although candlestick charts are more complex than line charts, they provide detailed information showing price action in stocks, futures, and other markets.
There are many different ways to interpret candlestick charts, but one of the most popular is to use them to identify potential reversals in the market.
For example, when monitoring specific stocks like the Telstra share price from HALO Technologies, if the market is in a downtrend and a candlestick chart forms with a long upper shadow and small lower shadow, this could indicate that the market is about to reverse course and head higher.
Bar Stock Charts
Bar stock charts are the most complex type of stock chart component, but they offer the most information. A bar stock chart uses rectangular bars to represent different values, such as the closing price of a stock. These are often used to compare data sets or track changes over time.
These are valuable tools for investors and traders alike to visualize data in many different ways, including comparing the performance of various stocks or tracking the trend of a stock over time. It can also be used to identify critical points in the market, such as support and resistance levels.
When used correctly, bar stock charts can provide valuable insights into the market and help you make better investment decisions.

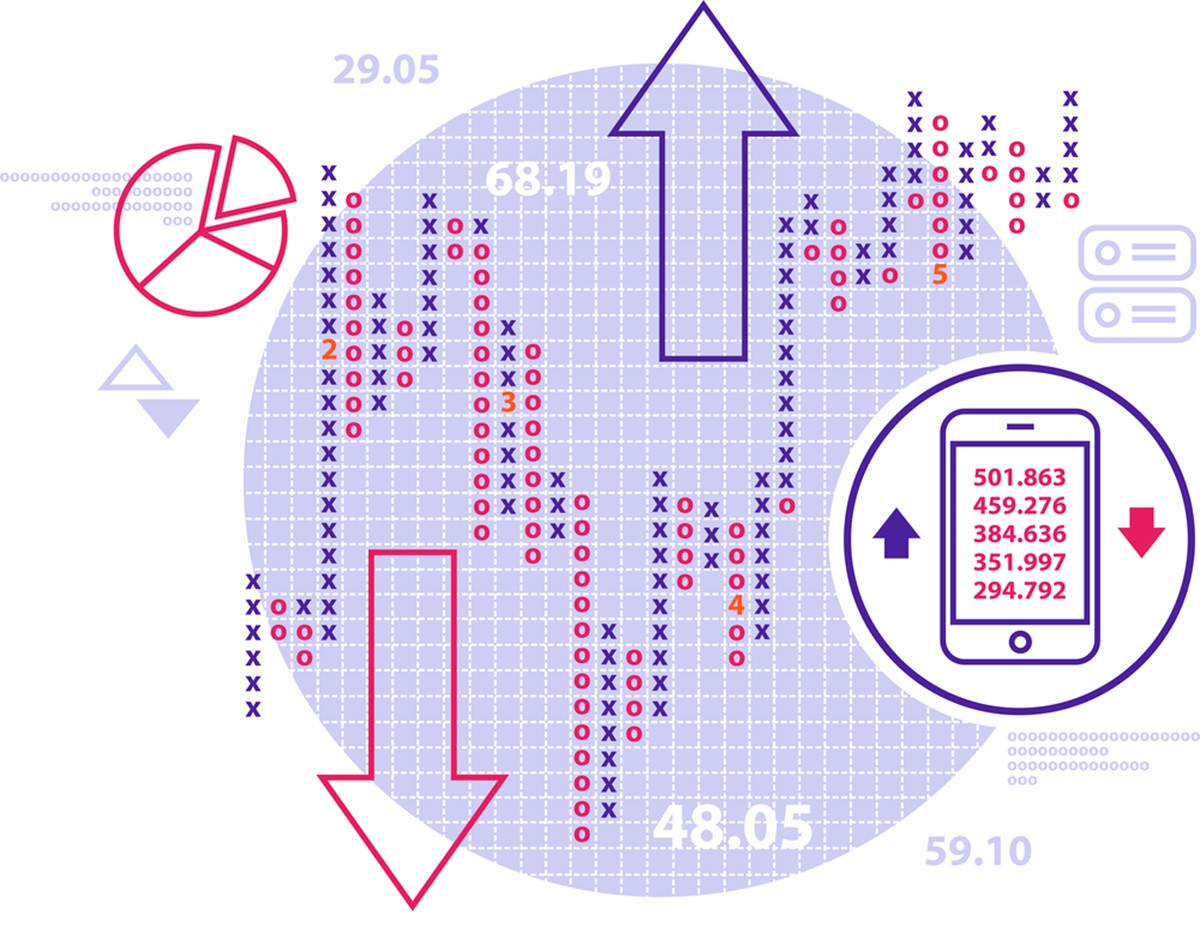
Point and Figure Charts
Point and figure charts represent stock price movements that use a specific set of rules to identify patterns and stock market trends. The main advantage of point and figure charts is that they are easy to construct and interpret, making them valuable technical analysis tools.
Point and figure charts can be used to identify support and resistance levels and trend lines and patterns such as reversals and continuation. These features make point and figure charts an essential tool for traders and investors deciding when to buy or sell a security.
While point and figure charts have many benefits, there are also some drawbacks to using this type of chart.
One major disadvantage is that point, and figure charts only consider stock price movements and do not consider other important factors such as volume or news.
Another disadvantage of point and figure charts is that they can be subjective since there is some flexibility in the rules used to construct them.
This means that two different traders may look at the same chart and come to different conclusions about what the data is telling them.
Important Things to Know to Read a Stock Chart
Now that you know about stock charts, it’s time to study one.
Stock charts can only be considered a valuable tool if one knows how to read information and comprehend the lines, numbers, and texts shown to make accurate predictions of the stock’s performance in the future.
So, below are the five key data points you must understand to grasp the whole point of stock market readings fully.
Types of Chart Patterns
When analyzing data, it is crucial to look for patterns that can give clues about future price movements. These chart patterns can identify potential reversals, breakout points, and continuation signals.
There are many different types of chart patterns helpful in analyzing data and making predictions, giving valuable information about the direction of a stock’s price.
Common patterns include trend lines, support and resistance levels, Fibonacci retracements, head and shoulders formations, double bottoms, and triangles.
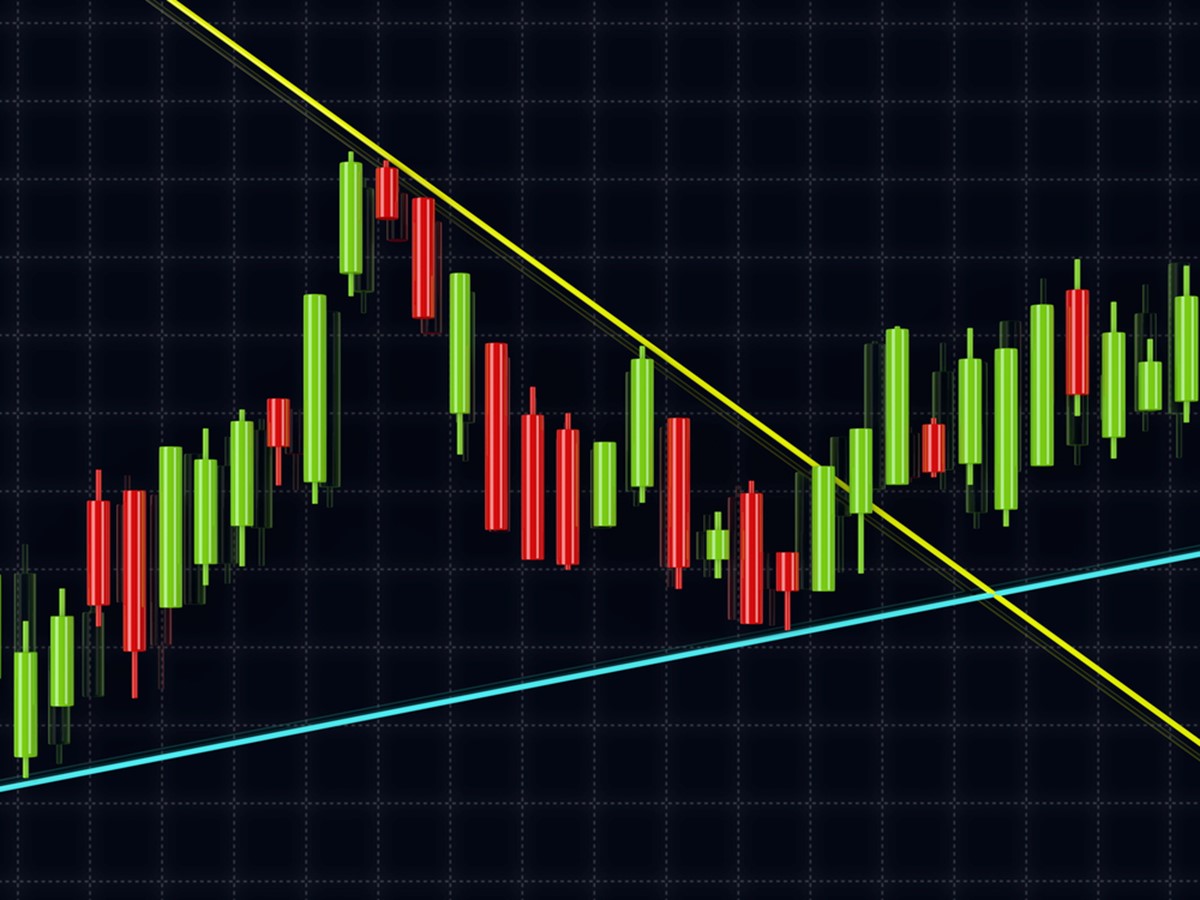
Trend Lines
Trend lines are used to identify the direction of a trend. Support and resistance levels can be used to identify potential reversal points. Fibonacci retracements can predict how prices may move after a sharp move higher or lower.
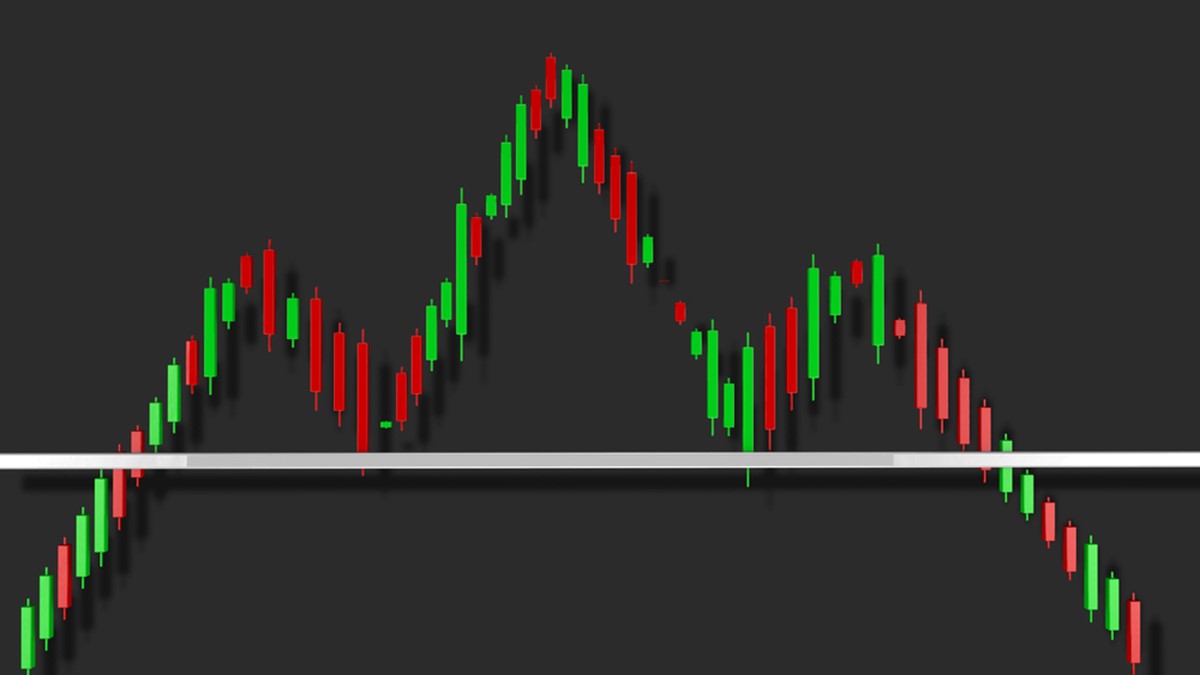
Head and Shoulders Formations
This pattern is a chart formation with three peaks, with the one in the middle being the highest and the ones on the outside sitting nearly even with each other.
Each peak can identify when the price of security creates lower highs and higher lows.
Double Bottoms
While double bottoms and triangles indicate that the stock price is struggling to break through a certain level, they have distinct differences in their shapes.
Double bottoms form when the price hits a support level and bounces back up, only to retest the same level before finally breaking out above it. This breakout signals a change in trend from downward to upward and can be used by traders to enter long positions.
The critical thing to look for in a double bottom pattern is a second bounce off of the higher support level than the first. This creates a “W” shape on the chart, where the name comes from.
The breakout point is typically above the highest point of the “W” and marks the beginning of the new uptrend.
Triangles
Triangles are created when the price of security creates lower highs and higher lows, creating a converging triangle pattern. As the price action gets closer to the triangle’s apex, traders will watch for a breakout above or below the trendlines to signal which direction the security is likely to move.
Each chart pattern has its own strengths and weaknesses, so it is essential to use them with other technical analysis tools. For example, a head and shoulders formation may be more reliable when used with support and resistance levels. Similarly, a Fibonacci retracement may be more accurate when used with trend lines.
When analyzing data, it is vital to look for multiple types of chart patterns and use them together to form a complete picture. By doing so, traders can make more informed decisions about when to enter or exit a position.
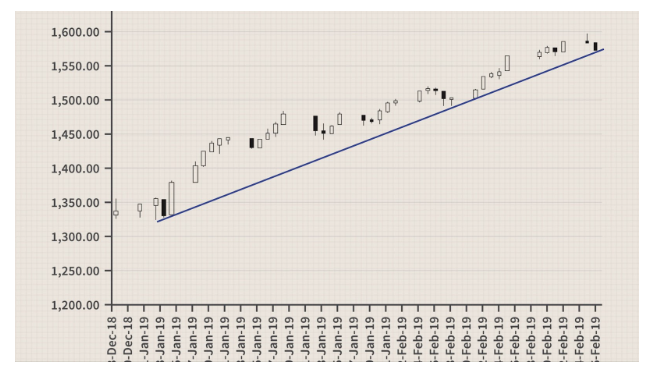
Identifying the Trend Line
A trend line is a straight line that connects two or more price points on a chart. It is used to visualize and identify trends in data sets, whether rising, falling, or stagnant.
In the stock market, trend lines can identify both short-term and long-term price movements.
The angle of the trend line will depend on the time frame that is being considered. For example, a trend line on a monthly chart will have a shallower angle than a trend line on a daily chart.
When constructing a trend line, it is vital to use as many data points as possible. The more data points used, the more reliable the trend line will be.
It is also vital to ensure that the data points used for the trend line are relevant. For example, using data from a 10-year period to construct a trend line on a monthly chart would not be relevant.
Once a trend line has been constructed, it can be used to predict future price movements. If the price of a security breaks below a support trend line, it is often seen as a sign that the price will continue to fall.
Similarly, if the price of security breaks above a resistance trend line, it is often seen as a sign that the price will continue to rise.
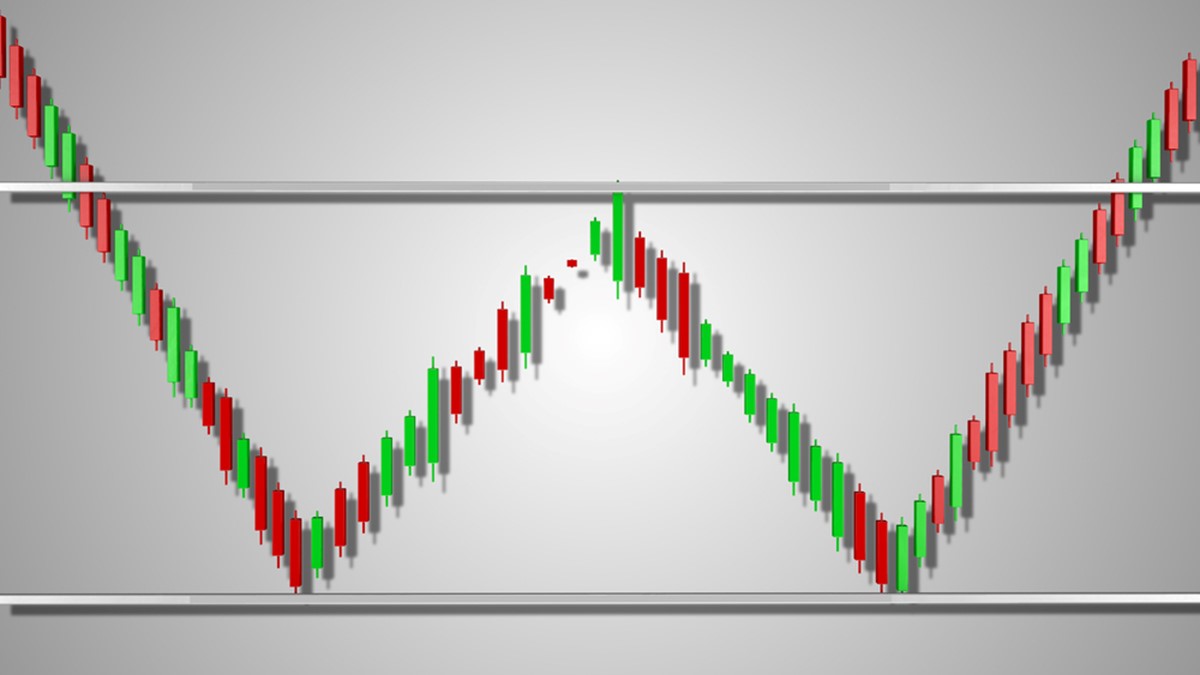
Identifying the Lines of Support and Resistance
In stock chart analysis, support and resistance are key concepts. Support trend lines act as a floor, providing a level at which the security price tends to find support. On the other hand, resistance trend lines act as a ceiling, providing a level at which the price of a security tends to find resistance.
There are a few ways to identify potential support and resistance levels. One way is to look for previous price levels where the stock reversed course. These levels are likely to act as support or resistance in the future.
Another way to identify potential support and resistance levels is by using trend lines.
Once potential support and resistance levels have been identified, it is essential to watch for price action around these levels. If the price bounces off of a support level or stalls at a resistance level, this is a sign that these levels are significant.
Conversely, if the stock price breaks through a support or resistance level, this can signify that the level is no longer significant.
Support and resistance levels are essential for stock traders to watch because they can provide clues about where the price is likely to move.
By understanding how to identify and interpret these levels, traders can make more informed decisions about when to buy and sell shares.
Knowing the Occurrence of Dividends and Stock Splits
A dividend is a portion of a company’s profits distributed to shareholders. A stock split is when a company divides its shares into multiple pieces.
For example, if a company has 100 shares and splits them into two, each shareholder would have two shares.
Dividends and stock splits can impact the price of a stock as well. If a company announces a dividend, the stock price may go up.

Likewise, if a company announces a stock split, the stock price may also go up, evident in the uptick in the trend line after the split occurred.
This is because after the split happens, more people invest since the share price is often lower, which increases the demand, and in many cases, the overall share price.
Understanding the Trading Volume
One of the most important things to understand in stock charts is the trading volume.
This is because this activity can give you a good indication of where the market is heading and whether or not there is enough buying or selling pressure to make a move.
When you see high volume on a stock chart, there is a lot of activity going on in the market for that particular stock. This can be either good or bad, depending on the direction of the move.
If the stock is moving up, there is a lot of buying pressure, and the stock is likely to continue moving up.
However, if the stock is moving down, there is a lot of selling pressure, and the stock is likely to continue moving down.
Overall, understanding trading volume on stock charts is essential for day trading. It can help you confirm price moves and give you an idea of where the market is heading.
How to Read the Stock Market: Final Thoughts
While choosing the right trading strategy is crucial in making a profit, reading stock charts and comprehending stock market news is also crucial with stock trades.
By understanding the stock chart components and how they affect the current stock price, traders can make informed investment decisions and maximize their investments.
 Tags:
Tags: