
Warren Buffett once said, “Price is what you pay, value is what you get.” Buy low and sell high is the most basic and fundamental rule of investing in stocks.
It’s the goal of every investor. And there is no better way to generate a great return on your investment than to buy stocks that are trading at a discount to their real or intrinsic value.
Always remember, the stock price does not always align with its value. There are plenty of stocks with the good value being sold for a low price, and buying the right one (at the right time) could seriously increase your annual earnings.
If you follow my five-step process, you can find winners that are trading on the stock market at a hefty discount. These strategies can improve both your short-term and long-term profits.
This guide will teach you my 5-step process for finding undervalued stocks. If you follow the steps below, you should be able to find stocks that are trading at a discount to their real value.
Stocks that are just waiting for an investor like you to come along and buy them.
There are many different ways of finding undervalued stocks, but this 5-step process is based on the most common methods used by investors, analysts, and professional money managers.
The process is very straightforward and easy to follow. And it should take you less than 15 minutes to complete.

What is Value Investing? How to Find Undervalued Stocks
The type of investing that I’m referring to here is called value investing. Value investors use a variety of different techniques to find stocks that are trading below their intrinsic value.
They then buy those stocks in the hope of selling them later for a profit.
Value investors believe that the markets are inherently inefficient and that all stocks are vaguely priced at all times.
They believe it’s not possible to consistently find stocks that are trading at a discount to their true value. And this belief leads many value investors to simply buy an index fund since that’s the only way for them to be certain they won’t pay too much for individual stocks.
But, value investors who don’t believe the market is perfectly inefficient have to try very hard to find bargains to outperform the market and beat their own benchmarks.
And this is where my 5-step process comes in handy. It will help you locate undervalued stocks with great consistency. This may allow you to achieve outstanding returns over time without taking on much risk.
Here’s how my 5-step process works:
Step 1: Look For Companies That Are More Efficient Than Average
To find undervalued stocks, you need to approach the process of investing in a fundamentally different way than most investors.
Most investors will try to find undervalued stocks by looking for companies that are going through tough times, like the ones that are currently trading at a discount to their intrinsic value.
Stock screeners
A good place to start looking is by using a stock screener. In the simplest of terms, these are tools designed to filter stocks based on a set of predefined criteria. Best of all, you can look for a free stock screener online that allows you to input your own metrics.
Finding undervalued stocks
If you want to find undervalued stocks, you need to look for companies that are more efficient than average and trade at a premium to their intrinsic value. You can look for companies with attributes that increase their efficiency.
Here’s an example:
Let’s say I wanted to find undervalued stocks in the retail sector. I would first examine the list of companies that are in this sector and then I would start looking at each company’s stock chart one by one, trying to identify those that have been trading near their 52-week high and have been showing signs of slowing down.
This is exactly what most investors do when they are searching for undervalued stocks in any given market segment.
And this strategy makes sense because it allows them to buy a stock after it has already fallen significantly. This means they will get more shares of the company’s stock for less money.
And, they will be able to achieve better returns on their investment.
Intrinsic Value
However, this is not the most effective way to consistently find undervalued stocks.
To have a better chance of finding undervalued stocks, you need to look for companies that are more efficient than average and trade at a premium to their intrinsic value.
This means that they have more valuable businesses than other competitors in their industry or sector. This means they don’t need as much money to generate higher profits and cash flow than others do.
For example, imagine we had two companies: one is selling widgets but its business model is very inefficient. It costs much more money and takes longer for it to produce each widget than it does for its competitors.
So, this company’s stock has been trading near its 52-week low, which means it might be an interesting investment opportunity for value investors like us.
But if we bought into this company, we would likely be disappointed. This is because we would be paying too much for a company that is very inefficient.
In contrast, imagine we had another company: this one is also selling widgets but its business model is very efficient.
It costs much less money and takes less time for it to produce each widget than it does for its competitors.
This is why I always try to look at the efficiency of a company. This is exactly what Warren Buffett recommends.
He says that investors should always look at the returns on invested capital (ROIC) before deciding whether or not they should buy a stock in an industry or sector.
To find undervalued stocks, you need to use some financial ratio analysis. And the most commonly used ratios are price-to-earnings ratio (P/E Ratio) and non-GAAP earnings per share (Non-GAAP EPS).
You can find both of these figures on any company’s income statement and they are usually reported in the same way as GAAP earnings per share (GAAP EPS).
The P/E ratio is calculated by dividing a company’s stock price by its earnings per share, which is the same as saying that it is a company’s market capitalization divided by its earnings.
If a stock price is $50 and the annual EPS is $10, the P/E ratio will be 5. This tells you how much you have to pay for each dollar of earnings. If you divide 50 by 10, then you get 5.
Now, P/E ratios can be useful when finding undervalued stocks. However, I don’t rely on them too much because they don’t tell me everything about a company’s stock value.
For example, if I’m looking for undervalued stocks, I’ll want to make sure that the P/E ratio for a company is lower than the industry average because this will tell me that this company is trading at a discount to its peers.
However, just because a company has a low P/E ratio doesn’t mean it’s necessarily undervalued.
The P/E ratio doesn’t take into account all of the factors that affect a stock price and so it’s not always an accurate measure of the value of a stock.
It also doesn’t tell you how much money a company is actually making. This means it might say more about how much investors are willing to pay for each dollar of earnings.
It says more than it does about how much money the company is actually earning.
Non-GAAP EPS
To find out how much money companies are actually making, you need to look at Non-GAAP EPS. Non-GAAP EPS takes into account all aspects that affect earnings.
It also adjusts for one-time gains as well as charges. It gives investors an accurate picture of how much money the company is actually making or losing annually.
Now that we have a better metric to use, let’s take a look at how we can find undervalued stocks using Non-GAAP earnings per share (Non-GAAP EPS). Here’s what to do:
Look up the P/E ratio for each company on Yahoo Finance or any other financial website. Calculate the average P/E ratio for each industry that you’re interested in.
For example, let’s say that you want to invest in the retail industry. You find that the average P/E ratio for retailers is 15.3. This information can be found on Yahoo Finance or Morningstar.
Once you have this average P/E ratio for each industry, divide each company’s P/E ratio by this average.
For example, if I want to buy a retailer stock with a P/E ratio of 8, then I would divide 8 by 15.3 and the result will be 0.5318582082, or 53%. This means that this stock is trading at 53% below the industry average P/E ratio.
This is just one way of determining how undervalued stock is. It’s not perfect because it doesn’t take into account the actual earnings of a company.
Check the price/earnings-to-growth ratio (PEG ratio)
Another honorable mention to consider before moving down the list is the PEG ratio. Many investors look to this metric as the starting point of their search for an undervalued stock. In essence, this ratio draws a comparison between the price/earnings and the expected growth.
All you need to do is divide the P/E ratio by the company’s expected earnings growth rate. If the PEG ratio is below 1, the stock may be undervalued.
Keep in mind, however, that the “expected growth” part of the equation is a projection.
You may be wondering why I’m including dividends per share and dividend yield in my 5-step process for finding undervalued stocks.
The reason is that these two factors can have a significant impact on how undervalued stock is. Therefore it has an impact on how much it has the potential to produce in return for us.
If a company does not pay out dividends, there’s no way for an investor to make any money. The only way for an investor to profit would be if the stock goes up significantly over time.
So, I need to take into account whether or not they pay out dividends. This will tell me how much money I can make from them.
And, dividend yield can also tell me how much money I can make from each dollar of equity in the company.
Dividend per share is simply the amount of money being paid out to investors in dividends on the company’s common stock each year that is divided by the number of shares outstanding.
It tells us how much money on average each investor in the company can expect to receive as a dividend payment over one year.
I’m not going to go into much more detail about dividends per share. There isn’t really anything too tricky about it. It just tells us how much money we can expect to make from each share of stock in a company.
This is until they start paying dividends again or if they never pay them again. And that’s all you need to know to evaluate whether a stock is undervalued or not.
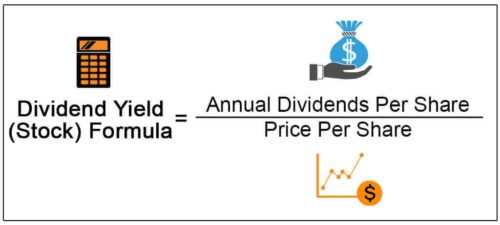
Dividend Yield (DY) (aka Current Yield)
Dividend yield (aka current yield) is a similar measure to dividend per share, but it tells us how much money on average each investor in the company can expect to receive as a dividend payment over one year as a percentage of the current share price.
This is important because it allows us to compare the yields of different companies and see which ones are offering the best dividends.
This is also helpful. We can use it to calculate how much we’ll make from a stock. It also tells us how much we will make if our investment increases in value by a certain amount.
So let’s say that I buy shares in Company A for $20 each and they pay a 3% dividend. After one year I can expect to receive $6 per share as a dividend payment ($20 x 3%).
This will mean that I’ll have made $1 per share from my investment ($6 divided by $20). This means that I’ve made 6% on my capital for that year.
This is much better than my bank account would have done if I had left the money there.
Step 4: P/B Ratio and Price to Sales Ratio
P/B Ratio
The P/B (Price-to-Book) ratio shows us how much a company is worth on a per-share basis relative to the book value of its assets.
The book value of a company’s assets can be thought of as the theoretical value of the company’s assets if they were liquidated and sold off.
In other words, it’s the amount of money that would be left over after all debt was paid off and all assets were sold at their market value.
So, P/B tells us how many dollars in market value a stock represents for each dollar of book value. The higher this ratio is, the more undervalued the stock is at that particular moment in time.
Values above 1 usually indicate an undervalued stock, and values below 1 usually indicate an overvalued stock. This only indicates whether or not a stock is undervalued or overvalued compared to its book value.
It doesn’t tell us anything about whether or not it will eventually produce a profit for us as an investor.
Price to Sales Ratio
The P/S (Price-to-Sales) ratio is a measure of how expensive a company’s stock is relative to its sales. It tells us how much we’re paying for each dollar of the company’s sales.
The higher the P/S ratio, the more undervalued the stock. Values above 1 usually indicate an undervalued stock, and values below 1 usually indicate an overvalued stock.
This can also be used as a way to calculate how long it would take for us to break even.
Step 5: Debt-to-Equity Ratio (D/E) and Free Cash Flow Yield (FCF/Y)
Debt-to-Equity Ratio (D/E)
The Debt-to-Equity ratio measures how much debt a company has compared to its equity. If you buy stocks in companies with no debt then you won’t have any debt on your balance sheet.
You also won’t have to pay any interest on your investment. This helps reduce risk. If all goes well, your investment should increase in value.
You can then sell it for more money than you bought it for. This is what will make you money. You’ll get to keep all of the money that’s left over after the debt has been paid off.
But if things don’t go well, you may lose some or all of your investment and you may even owe interest on it if there is debt on your balance sheet.
So the lower the company’s debt-to-equity ratio, the lower your risk is going to be. And this means that companies with a low debt-to-equity ratio are generally considered to be less risky investments than companies with a high debt-to-equity ratio.
Companies with a high D/E ratio will have more debt on their balance sheet which means they have less equity (shares minus preferred stock).
This means that their assets are not as secure as those of companies with a low D/E ratio. So to protect my investment, I’ll want to avoid buying stocks in companies with high debt-to-equity ratios.
This is because they are more likely to go bankrupt.
Free Cash Flow to Equity (FCFE)
The Free Cash Flow to Equity ratio measures how much cash a company is generating that’s available for shareholders.
The FCFE is calculated by taking the company’s free cash flow and dividing it by the number of their outstanding shares.
It’s an important calculation because it helps investors determine how much cash a company has available for them to reinvest into the business or payout to shareholders in the form of dividends, share repurchases, or stock buybacks.
If a company has a lot of cash on hand, it should be able to pay out dividends, buy back its own stock, and make acquisitions without having to take on any debt or issue more shares to raise funds.
This is another way of determining whether a company is undervalued or not. Because if they have lots of cash, they should be able to pay out dividends and increase their earnings per share without having to borrow money.
This means if you buy shares in them at this time, you’ll get paid back for your investment with interest at some point in the future.
If there isn’t much free cash flow on hand, however, a company may have to take on debt and issue more shares, which will reduce the value of your existing shares.
So it’s best to avoid companies with high FCFE ratios because they are likely to have an increased risk of bankruptcy than those with low FCFE ratios.
 Tags:
Tags: