Investing has evolved, and today, investors can own many stocks without buying each one individually. Exchange-traded funds (ETFs) let retail investors own hundreds to thousands of stocks tracking an index. Two popular ETFs are the Vanguard 500 Index Fund ETF (VOO) and the Vanguard Total Stock Market Index Fund ETF (VTI).
Many investors use these ETFs in their lazy retirement portfolios as their core funds. The funds are giants with hundreds of billions in assets. The two funds are different but also have some similarities. Below we compare and contrast VOO vs. VTI to help you decide which one you prefer.
Overview of VOO vs VTI
VOO and VTI are two of the most popular ETFs because they track two well-liked benchmarks. On the surface, the two funds seem similar because they are both offered by Vanguard and cover much of the market. But in reality, they are very different ETFs. The table below summarizes the basics of the two funds.
|
Ticker |
VOO |
VTI |
|
Name |
Vanguard 500 Index Fund ETF |
Vanguard Total Stock Market Fund ETF |
|
Index |
S&P 500 Index |
CRSP US Total Market Index |
|
Number of Stocks |
505 |
4,100 |
|
Expense Ratio |
0.03% |
0.03% |
|
Price |
$345.68 |
$188.02 |
|
30-Day SEC Yield |
1.45% |
1.39% |
|
P/E Ratio |
20.2X |
19.3X |
|
Total Assets |
$766.3B |
$1.2T |
In comparing VOO vs. VTI, both ETFs have an expense ratio of 0.03%, an extremely low cost to investors. This fact means that the funds charge a 0.03% fee, so an investor with $1,000 in either fund will pay $0.30 in fees. According to Vanguard’s website, the costs are deducted from the dividends and capital gains, not the principal. Low expense ratios are essential because they subtract from total performance.
Both ETFs do not have a minimum investment. However, VOO costs nearly double VTI for a single share. In addition, investors typically cannot buy fractional shares of ETFs, which may be a consideration when deciding between VOO vs. VTI.
VTI is more popular than VOO, with greater assets under management (AUM) of around $1.2 trillion compared to about $766.3 billion.
Next, VTI has a slightly lower 30-day Securities and Exchange Commission (SEC) yield of 1.39% versus VOO’s value of 1.45%.
Lastly, VTI has a lower price-to-earnings (P/E) ratio of 19.3X compared to VTI’s multiple of 20.2X. The valuation difference occurs because VTI holds many small- and mid-cap stocks not found in VOO. The recent bull market favored large- and mega-cap stocks and caused VOO’s valuation to rise. Although, the current bear market has lowered the S&P 500’s P/E ratio and consequently that of VOO.
Underlying Index
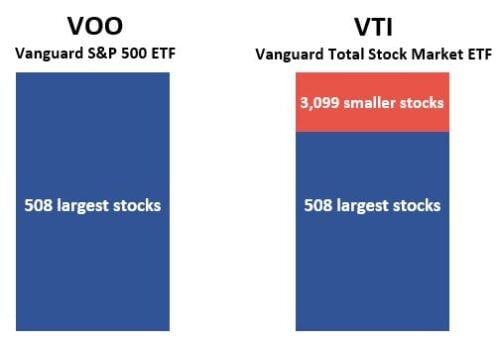
The main difference between VOO and VTI is the underlying Index each track. VOO tracks the S&P 500 Index, while VTI tracks the CRSP US Total Market Index. Both indices are market weighted.
The S&P 500 Index is comprised of the 500 largest US companies. Although the Index does not contain the entire stock market, it represents most of the total market capitalization. On the other hand, the CRSP US Total Market Index consists of small, mid, and large-cap stocks.
The different Indices used by the two funds mean VOO holds fewer stocks and a lower median market capitalization than VTI. VOO owns 505 stocks versus 504 in the S&P 500 Index, and the median market cap is about $165 billion. VTI holds 4,100 stocks versus 4,094 in the CRSP US Total Market Index, with a median market cap of about $129 billion.
Because of the different underlying Indices, the ETFs emphasize varying stock styles. For example, VOO has about 84% in large-cap stocks, with the rest in mid-cap stocks, and owns no small-cap stocks. On the other hand, VTI holds approximately 73 large-cap stocks, 19% mind-cap stocks, and 8% small-cap stocks.
Holdings and Sectors
The top 10 holdings for both ETFs are similar since the benchmarks are both market-weighted. However, the top 10 holdings are not precisely the same, and the weightings differ. One reason is that the VTI employs an index sampling technique. Hence, it may not own all the stocks, and the weighting may differ from the benchmark.
For example, Apple is the top holding for both ETFs, but the weightings are 6.53% for VOO and 5.55% for VTI. Besides the weighting, the main difference is at the number 10 position; VOO owns Nvidia (NVDA), while VTO owns Facebook (FB), now Meta (META).
Top 10 Holdings in VOO
The top 10 holdings comprise about 27% of the fund.
|
Ticker |
Company |
Weighting (%) |
|
AAPL |
Apple |
6.53% |
|
MSFT |
Microsoft |
5.77% |
|
AMZN |
Amazon.com |
2.98% |
|
GOOGL |
Alphabet Class A |
1.94% |
|
TSLA |
Tesla |
1.80% |
|
GOOG |
Alphabet Class C |
1.79% |
|
BRK.B |
Berkshire Hathaway Class B |
1.64% |
|
JNJ |
Johnson & Johnson |
1.34% |
|
UNH |
UnitedHealth Group |
1.32% |
|
NVDA |
Nvidia |
1.32% |
Source: Vanguard Website (as of May 31, 2022)
Top 10 Holdings of VTI
The top 10 holdings comprise about 22% of the fund.
|
Ticker |
Company |
Weighting (%) |
|
AAPL |
Apple |
5.55% |
|
MSFT |
Microsoft |
4.90% |
|
AMZN |
Amazon.com |
2.50% |
|
GOOGL |
Alphabet Class A |
1.66% |
|
TSLA |
Tesla |
1.51% |
|
GOOG |
Alphabet Class C |
1.46% |
|
BRK.B |
Berkshire Hathaway Class B |
1.29% |
|
JNJ |
Johnson & Johnson |
1.14% |
|
UNH |
UnitedHealth Group |
1.12% |
|
FB |
Facebook Class A |
1.08% |
Source: Vanguard Website (as of May 31, 2022)
Differences in Indices and the method of tracking the benchmark mean sector weighting differs. The tables below outline the weighting differences between the two ETFs relative to their benchmarks.
Both ETFs are strongly weighted toward Healthcare and Technology, although VTI is less so. In addition, because of its greater exposure to mid-and small-caps, it is more diversified.
|
Sector |
VOO |
S&P 500 Index |
|
Basic Materials |
2.80% |
2.80% |
|
Consumer Discretionary |
10.90% |
10.90% |
|
Consumer Staples |
6.50% |
6.50% |
|
Energy |
4.80% |
4.80% |
|
Financials |
11.20% |
11.20% |
|
Healthcare |
14.40% |
14.40% |
|
Industrials |
7.70% |
7.70% |
|
Real Estate |
2.80% |
2.80% |
|
Technology |
27.10% |
27.10% |
|
Telecommunications |
8.80% |
8.80% |
|
Utilities |
3.00% |
3.00% |
Source: Vanguard Website (as of May 31, 2022)
|
Sector |
VTI |
CRSP US Total Market Index |
|
Basic Materials |
2.30% |
2.30% |
|
Consumer Discretionary |
14.00% |
14.00% |
|
Consumer Staples |
5.50% |
5.50% |
|
Energy |
5.00% |
5.00% |
|
Financials |
11.50% |
11.50% |
|
Healthcare |
13.40% |
13.40% |
|
Industrials |
12.80% |
12.80% |
|
Real Estate |
3.70% |
3.70% |
|
Technology |
25.90% |
25.90% |
|
Telecommunications |
2.60% |
2.60% |
|
Utilities |
3.30% |
3.30% |
Source: Vanguard Website (as of May 31, 2022)
Volatility and Performance
Both ETFs have a beta (volatility) of ~1.00 relative to their respective indices in the past 3-years meaning the funds perform the same as the benchmark during up and down markets. However, VOO is less volatile than the total market, with a beta of ~0.96. This result is expected since VTI contains riskier mid-and small-cap stocks.
Moreover, VTI has slightly more variable returns than VOO, with a standard deviation of approximately 18.88% versus 18.13%, which is again the expected result.
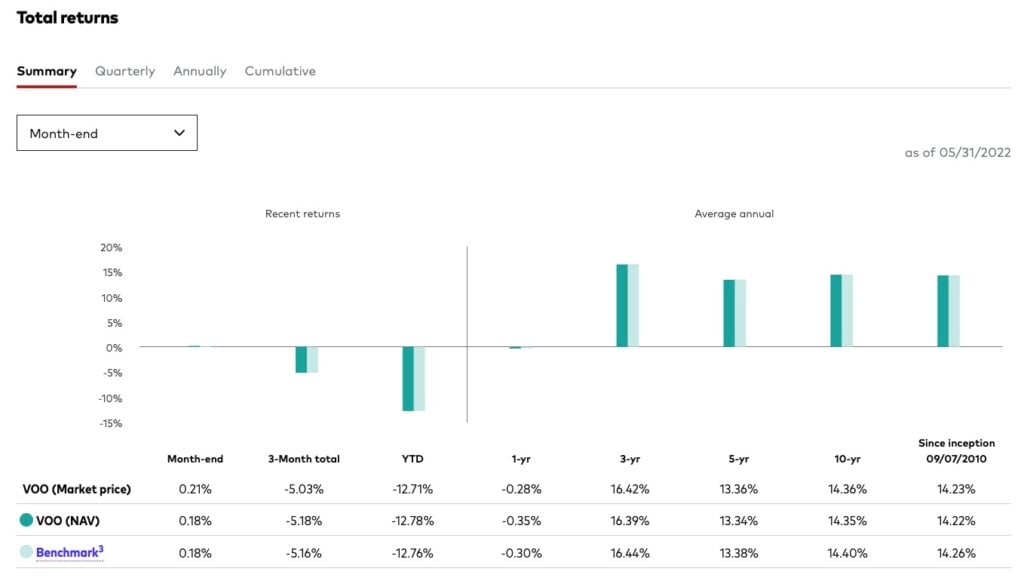
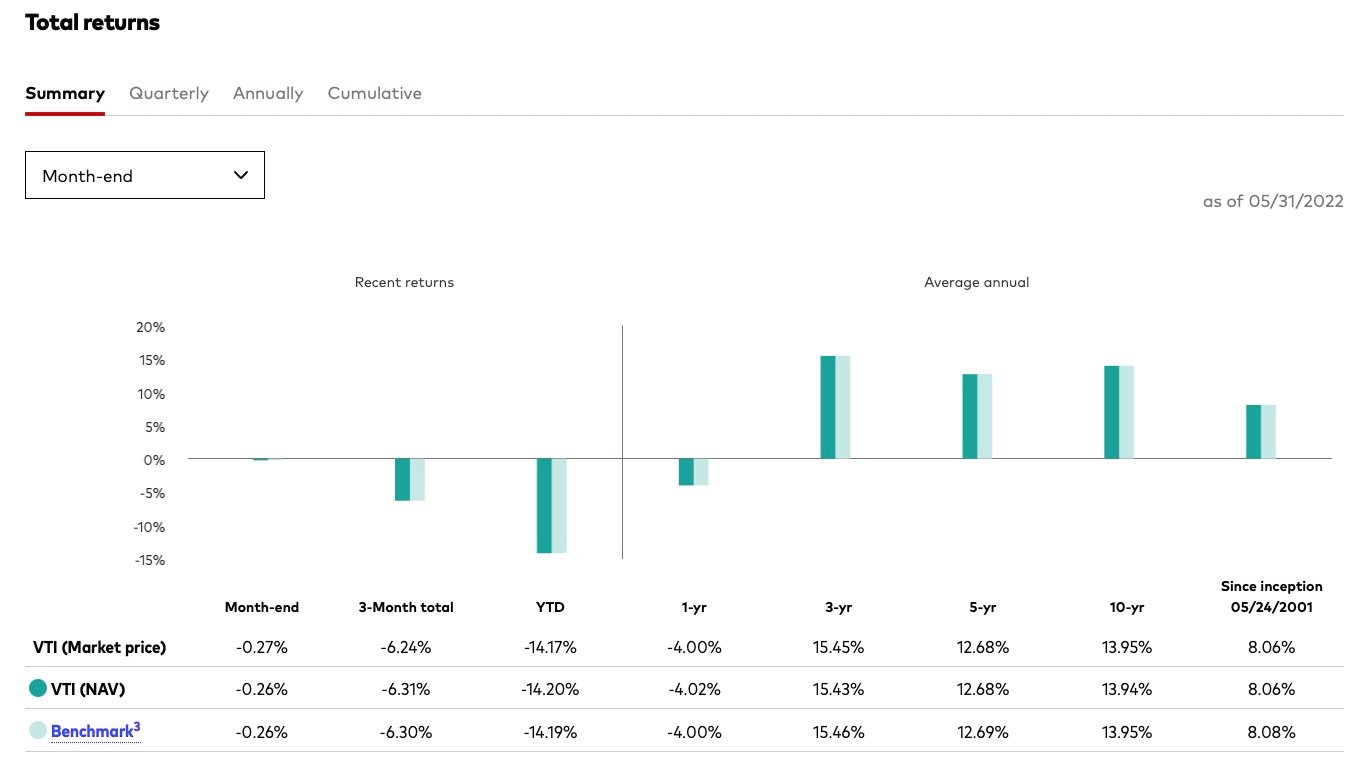
From a performance perspective of VOO vs. VTI, the former outperforms the latter for the 1-year, 3-year, 5-year, and 10-year periods. This outperformance is likely due to the greater relative percentage of healthcare and technology stocks. In addition, VOO underperforms its benchmark by nearly the expense ratio, but VTI matches the performance of its underlying Index.
Source: Vanguard Website (as of May 31, 2022)
Source: Vanguard Website (as of May 31, 2022)
Pros and Cons of VOO vs VTI
VOO Pros
- Tracks the S&P 500 Index
- Higher annualized total returns
- Less volatile than the broader stock market
- Lower variability of returns
- Low expense ratio
- Higher dividend yield
VOO Cons
- Less diversification with mostly large-cap stocks
- Concentrated in the Technology and Healthcare sectors
- Companies not in the S&P 500 are not included
VTI Pros
- Tracks the total stock market
- Greater diversification
- More exposure to mid-and small-cap stocks
- Low expense ratio
VTO Cons
- Concentrated in the Technology and Healthcare sectors
- Lower dividend yield
- Higher variability of returns
- Lower recent returns
Final Thoughts: VOO vs VTI
In comparing VOO vs. VTI, which one should an investor choose? The two ETFs are similar in many ways, and an investor would probably not go wrong with either one. An investor selecting either as a core for a lazy retirement portfolio to buy and hold would likely do well over time. Both funds have the same expense ratio but with some differences.
Disclosure: The author has no position in VOO or VTI.
Disclaimer: The author is not a licensed or registered investment adviser or broker/dealer. He is not providing you with individual investment advice. Please consult with a licensed investment professional before you invest your money.
 Tags:
Tags: